Unlock a world of possibilities! Login now and discover the exclusive benefits awaiting you.
- Qlik Community
- :
- Forums
- :
- Analytics
- :
- New to Qlik Analytics
- :
- Re: How to sum duplicates
- Subscribe to RSS Feed
- Mark Topic as New
- Mark Topic as Read
- Float this Topic for Current User
- Bookmark
- Subscribe
- Mute
- Printer Friendly Page
- Mark as New
- Bookmark
- Subscribe
- Mute
- Subscribe to RSS Feed
- Permalink
- Report Inappropriate Content
How to sum duplicates
Hello
Created a model to handle travelling expenses for service deliveries:
One table has the inter-deliveries data :
Provicer Id, Provider Name, Date of delivery, Customer1, Customer 2, End Hour Customer 1, Start Hour Customer 2, KeyCustomer1Customer2
One table has the travelling data :
KeyCustomer1Customer2, Distance, TIme
For 1 provider, the same inter delivery can happen several times a day but at different hours, and of course the same inter delivery can happen several days at the same time.
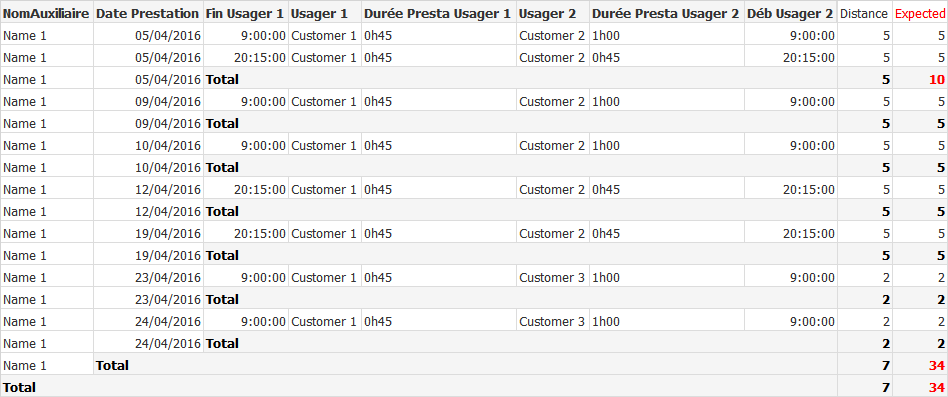
In the screenshot, maybe it is obvious to everyone but not for me; the sum only counts once each couple.
In the distance column, what I get, in the Expected column, what I would expect.
Can someone explain this behaviour and maybe a clue to get what I want in this configuration (Different from joining the tables at loading or using mapping) => I really thought that in that configuration, I would have what I expect.
Thanks
- Mark as New
- Bookmark
- Subscribe
- Mute
- Subscribe to RSS Feed
- Permalink
- Report Inappropriate Content
What about using the Sum(Aggr()) function here?
Sum(Aggr(YourCurrentExpression, AllYourDimensionsSeparatedByComma))
- Mark as New
- Bookmark
- Subscribe
- Mute
- Subscribe to RSS Feed
- Permalink
- Report Inappropriate Content
Thanks for the answer, but I really don't get the logic behind this.
This totally what I do not expect.
- Mark as New
- Bookmark
- Subscribe
- Mute
- Subscribe to RSS Feed
- Permalink
- Report Inappropriate Content
What were you expecting? Logic is to get the Sum of each row to the subtotal and total level. To do that I am suggesting you to use Sum(Aggr()). If you can share the expression you are using and the name of the dimensions, I can give you a new expression to try 
- Mark as New
- Bookmark
- Subscribe
- Mute
- Subscribe to RSS Feed
- Permalink
- Report Inappropriate Content
What you expect to get is total mode sum-of-rows in your partial sums, i.e. summing up all lines within the dimensional grouping.
What you get is total mode Expression Total, which is the result of the expression evaluated in the context of the dimension.
It seems that your distance is only linked by KeyCustomer1Customer2 to your dimension values, so looking at your first subtotal, it's just retrieving the distance for the combination of Customer1 and Customer2, regardless how often this combination happened on that date 05/04/2016.
In a straight table, you can chose between total mode sum-of-rows and expression total on expression tab, but for the pivot table chart, you can't. It always uses expression total.
But you can emulate the total mode sum-of-rows in a pivot table using advanced aggregation, like Sunny suggested.
(There is also a sample and explanation in the help file).
Hope this makes sense,
Stefan
- Mark as New
- Bookmark
- Subscribe
- Mute
- Subscribe to RSS Feed
- Permalink
- Report Inappropriate Content
Thanks a lot
- Mark as New
- Bookmark
- Subscribe
- Mute
- Subscribe to RSS Feed
- Permalink
- Report Inappropriate Content
Were you able to resolve the issue? or are you still having issues? If you have got everything resolved, I would suggest you to close this thread, else please let us know what is still missing.
Best,
Sunny