Unlock a world of possibilities! Login now and discover the exclusive benefits awaiting you.
- Qlik Community
- :
- All Forums
- :
- QlikView App Dev
- :
- %Split between 2 series month by month in Barchart
- Subscribe to RSS Feed
- Mark Topic as New
- Mark Topic as Read
- Float this Topic for Current User
- Bookmark
- Subscribe
- Mute
- Printer Friendly Page
- Mark as New
- Bookmark
- Subscribe
- Mute
- Subscribe to RSS Feed
- Permalink
- Report Inappropriate Content
%Split between 2 series month by month in Barchart
Hi,
I'm trying to create a % split between 2 different series within the same month
However, using my formula, I was only able to get a % split across the whole Year. This sounds pretty simple but it's got me scratching my head for a while...
This is my formula for each series:
Consumer:
Sum({<CustomerType={"Consumer"}>}Revenue) / Sum(TOTAL{<CustomerType={"Business","Consumer"}>}Revenue)
Business:
Sum({<CustomerType={"Consumer"}>}Revenue) / Sum(TOTAL{<CustomerType={"Business","Consumer"}>}Revenue)
Dimensions: ShortMonthOfYear, CustomerType
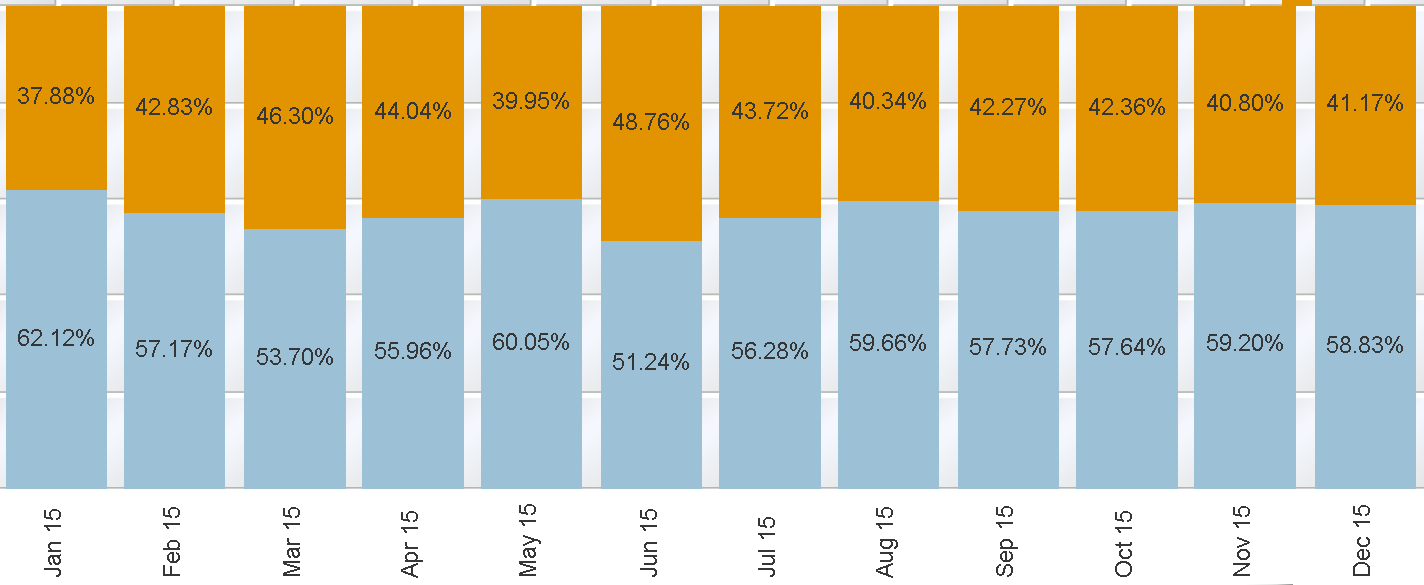
My desired output is %splits within the same month i.e. Jan 2016 should total to 100, Feb 2016 should total to 100...and so on..
Currently, it is split across the whole year
Can someone pls point out what I'm missing? I suppose I need to aggregate the series at the Month before I do any calculations?
Thanks.
- Mark as New
- Bookmark
- Subscribe
- Mute
- Subscribe to RSS Feed
- Permalink
- Report Inappropriate Content
I think you can try adding CustomerType as your second dimension and then try this expression:
Sum(Revenue) / Sum(TOTAL <MonthYearDimension> Revenue)
- Mark as New
- Bookmark
- Subscribe
- Mute
- Subscribe to RSS Feed
- Permalink
- Report Inappropriate Content
Hi,
I was able to achieve what I want using
Consumer:
aggr(Sum({<CustomerTypeName={"Consumer"}>}Revenue),ShortMonthOfYearName)
/ aggr(Sum({<CustomerTypeName={"Business","Consumer"}>}Revenue),ShortMonthOfYearName)
Business:
aggr(Sum({<CustomerTypeName={"Business"}>}Revenue),ShortMonthOfYearName)
/ aggr(Sum({<CustomerTypeName={"Business","Consumer"}>}Revenue),ShortMonthOfYearName)
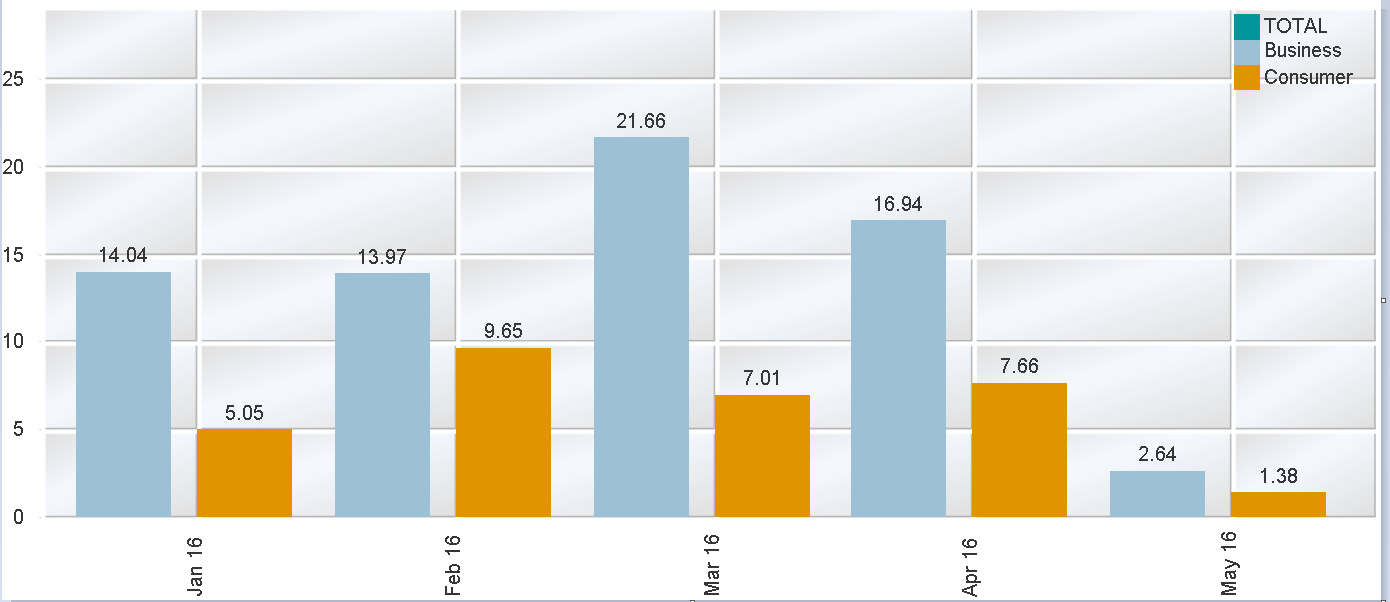
But it's still giving me stacked charts instead of grouped charts. Any hints?