Unlock a world of possibilities! Login now and discover the exclusive benefits awaiting you.
- Qlik Community
- :
- All Forums
- :
- QlikView Integrations
- :
- Re: Gantt chart with Gaps
Options
- Subscribe to RSS Feed
- Mark Topic as New
- Mark Topic as Read
- Float this Topic for Current User
- Bookmark
- Subscribe
- Mute
- Printer Friendly Page
Turn on suggestions
Auto-suggest helps you quickly narrow down your search results by suggesting possible matches as you type.
Showing results for
Not applicable
2016-05-16
12:04 PM
- Mark as New
- Bookmark
- Subscribe
- Mute
- Subscribe to RSS Feed
- Permalink
- Report Inappropriate Content
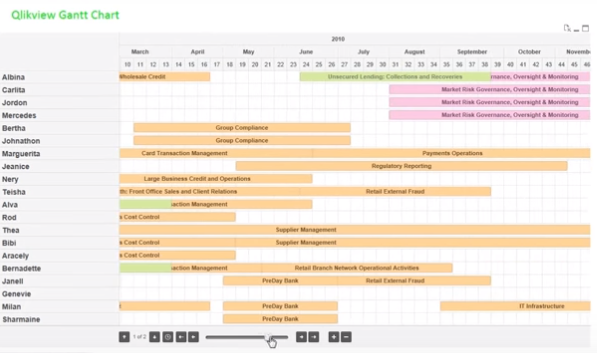
Gantt chart with Gaps
Does anyone have any ideas how to create a Gantt chart where there is a gap in the work stream, like in the example below (Albina, Milan).
My data is daily (binary either 1 or 0 for each day) rather than period based with start and end dates.
I've tried the bar chart on its side with offsets approach but can't get the gap that is required.
Any thoughts would be welcome.
Preferably without using extensions.
- Tags:
- qlikview_extensions
1,986 Views
1 Solution
Accepted Solutions
MVP
2016-05-16
12:35 PM
- Mark as New
- Bookmark
- Subscribe
- Mute
- Subscribe to RSS Feed
- Permalink
- Report Inappropriate Content
1,496 Views
1 Reply
MVP
2016-05-16
12:35 PM
- Mark as New
- Bookmark
- Subscribe
- Mute
- Subscribe to RSS Feed
- Permalink
- Report Inappropriate Content
1,497 Views