Unlock a world of possibilities! Login now and discover the exclusive benefits awaiting you.
- Qlik Community
- :
- Forums
- :
- Analytics
- :
- New to Qlik Analytics
- :
- Re: two dimension and one measure
- Subscribe to RSS Feed
- Mark Topic as New
- Mark Topic as Read
- Float this Topic for Current User
- Bookmark
- Subscribe
- Mute
- Printer Friendly Page
- Mark as New
- Bookmark
- Subscribe
- Mute
- Subscribe to RSS Feed
- Permalink
- Report Inappropriate Content
two dimension and one measure
Hi,
I need to represent a two dimensional and 1 measured data in Qlik sense which is interrcative as well.
I tried a lot of d3 visualization tools but it doesn't work
Basically one dimension has one group of the year 2015
and the other dimension has the same groups for 2014 and I want to show how many people in 2014 shifted to the same group of lower group in 2015. I need to show this via a tool
can anyone help me with this
- « Previous Replies
-
- 1
- 2
- Next Replies »
- Mark as New
- Bookmark
- Subscribe
- Mute
- Subscribe to RSS Feed
- Permalink
- Report Inappropriate Content
Hi ,
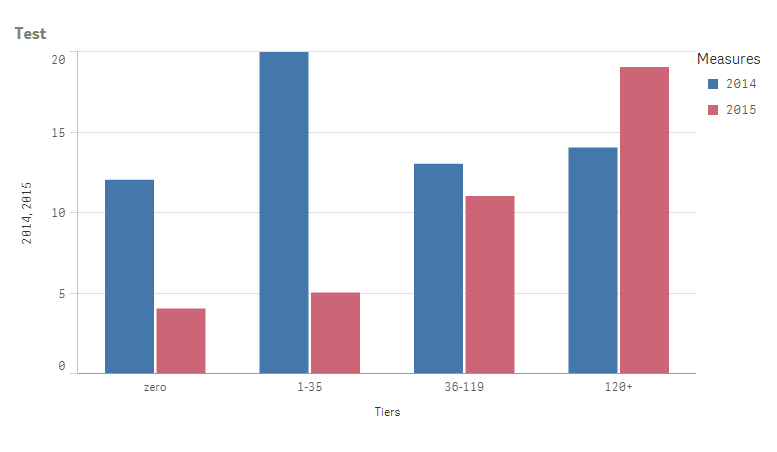
Is it like this ?
Try to add 0 as second expression
- Mark as New
- Bookmark
- Subscribe
- Mute
- Subscribe to RSS Feed
- Permalink
- Report Inappropriate Content
Hi,
this looks good
whats the procedure?
- Mark as New
- Bookmark
- Subscribe
- Mute
- Subscribe to RSS Feed
- Permalink
- Report Inappropriate Content
Can you post a small qlikview document with example data?
talk is cheap, supply exceeds demand
- Mark as New
- Bookmark
- Subscribe
- Mute
- Subscribe to RSS Feed
- Permalink
- Report Inappropriate Content
| Tiers | 2014 | 2015 |
| zero | 12 | 4 |
| 1-35 | 20 | 5 |
| 36-119 | 13 | 11 |
| 120+ | 14 | 19 |
- Mark as New
- Bookmark
- Subscribe
- Mute
- Subscribe to RSS Feed
- Permalink
- Report Inappropriate Content
Use a bar or line chart with Tiers as dimension and two expressions sum(2014) and sum(2015)
talk is cheap, supply exceeds demand
- Mark as New
- Bookmark
- Subscribe
- Mute
- Subscribe to RSS Feed
- Permalink
- Report Inappropriate Content
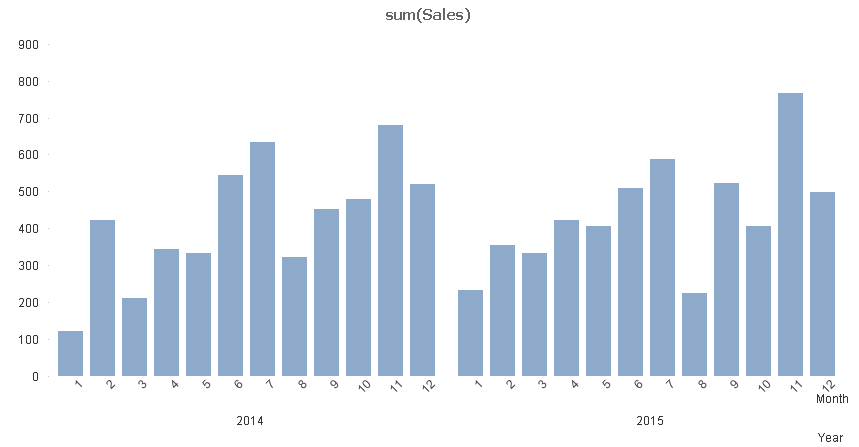
- Create a new bar chart with Year and Tier as dimensions and the expression: Sum(Sales)
- Edit the chart and add a second expression with just a value of 0:
- Open the properties and go to the Presentation tab. Deselect the Show Legend option:
- Edit the properties of the chart and go to the Axes tab. Set the Secondary Dimension Labels to the / option as shown in the following screenshot:
Note : The two dimensions must be in a strict hierarchy ( i.e Year should be added first in Dimension ....)
- Mark as New
- Bookmark
- Subscribe
- Mute
- Subscribe to RSS Feed
- Permalink
- Report Inappropriate Content
As gwassenaar mentioned..
- Mark as New
- Bookmark
- Subscribe
- Mute
- Subscribe to RSS Feed
- Permalink
- Report Inappropriate Content
HI Sagarika,
You can make use of a bar chart to achieve this.
Both bar chart and line chart allow two dimensions.
Thanks,
Sangram
- Mark as New
- Bookmark
- Subscribe
- Mute
- Subscribe to RSS Feed
- Permalink
- Report Inappropriate Content
Also, you can make use of drill down dimension to achieve this.
- « Previous Replies
-
- 1
- 2
- Next Replies »