Unlock a world of possibilities! Login now and discover the exclusive benefits awaiting you.
- Qlik Community
- :
- All Forums
- :
- QlikView Integrations
- :
- Re: scatter graph for the provided excel sheet
- Subscribe to RSS Feed
- Mark Topic as New
- Mark Topic as Read
- Float this Topic for Current User
- Bookmark
- Subscribe
- Mute
- Printer Friendly Page
- Mark as New
- Bookmark
- Subscribe
- Mute
- Subscribe to RSS Feed
- Permalink
- Report Inappropriate Content
scatter graph for the provided excel sheet
Hi
Can any one please help me in creating scatter graph for the below attached excel data. the should have x-axiz as A1,A2,A3,........ and so on...y-axis will should have mob,wate.... so on.. same data as in the excel sheet should be on the graph. no need of any aggregation functions. like example A1 to mob has value " ? ". this has to be displayed on the graph. corresponding to x and y axis.
- Mark as New
- Bookmark
- Subscribe
- Mute
- Subscribe to RSS Feed
- Permalink
- Report Inappropriate Content
Maybe a grid Chart might be possible.
- Mark as New
- Bookmark
- Subscribe
- Mute
- Subscribe to RSS Feed
- Permalink
- Report Inappropriate Content
Hi Macro,
How is grid chart possible can you please help me.
- Mark as New
- Bookmark
- Subscribe
- Mute
- Subscribe to RSS Feed
- Permalink
- Report Inappropriate Content
Hi,
although I think Stefan's solution using a pivot table should fit your requirements best, one solution using a grid chart instead could be:
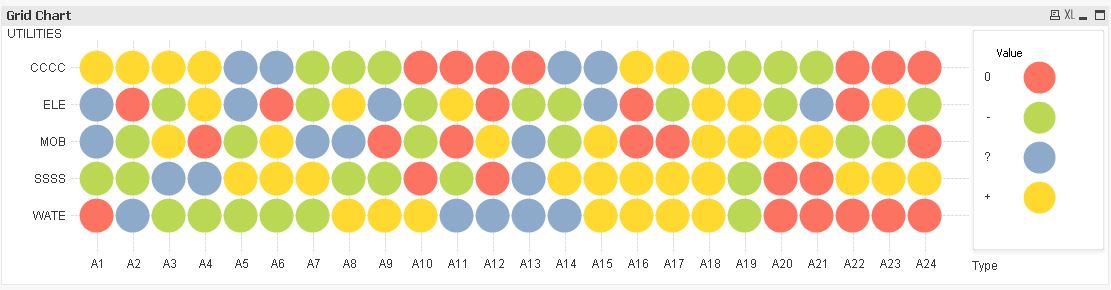
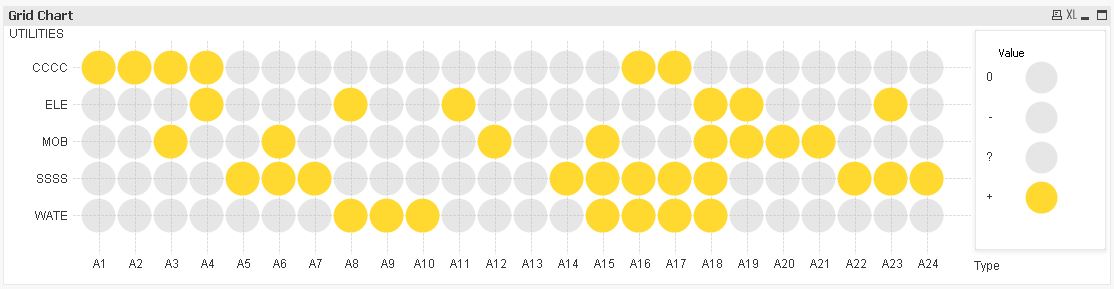
hope this helps
regards
Marco
- Mark as New
- Bookmark
- Subscribe
- Mute
- Subscribe to RSS Feed
- Permalink
- Report Inappropriate Content
Hi Macro,
Thanks a lot. This is wonderful.
But can you give me steps to do this chart using Qlik view personal desktop.
- Mark as New
- Bookmark
- Subscribe
- Mute
- Subscribe to RSS Feed
- Permalink
- Report Inappropriate Content
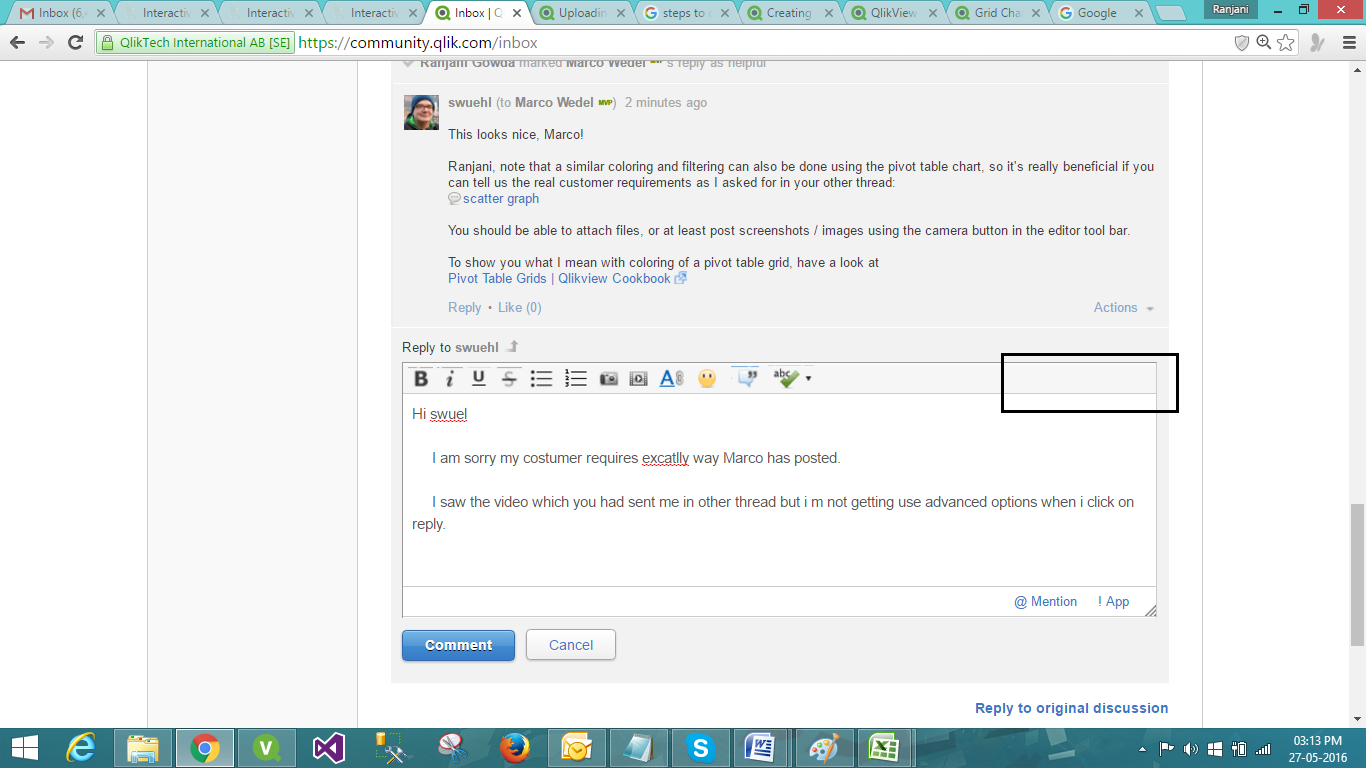
This looks nice, Marco!
Ranjani, note that a similar coloring and filtering can also be done using the pivot table chart, so it's really beneficial if you can tell us the real customer requirements as I asked for in your other thread:
You should be able to attach files, or at least post screenshots / images using the camera button in the editor tool bar.
To show you what I mean with coloring of a pivot table grid, have a look at
- Mark as New
- Bookmark
- Subscribe
- Mute
- Subscribe to RSS Feed
- Permalink
- Report Inappropriate Content
Hi swuel
I am sorry my costumer requires excatlly way Marco has posted.
I saw the video which you had sent me in other thread but i m not getting use advanced options when i click on reply. that is the reason i could not upload any files
- Mark as New
- Bookmark
- Subscribe
- Mute
- Subscribe to RSS Feed
- Permalink
- Report Inappropriate Content
Hey Marco,
Please reply as soon as possible. Its very urgent. Please tel what have you used in expression as well as in dimension. I am able to get so much. Please tel me what next to do. You can see in the below picture i able to get y-axis but not x-axis. so Please tel me what to do.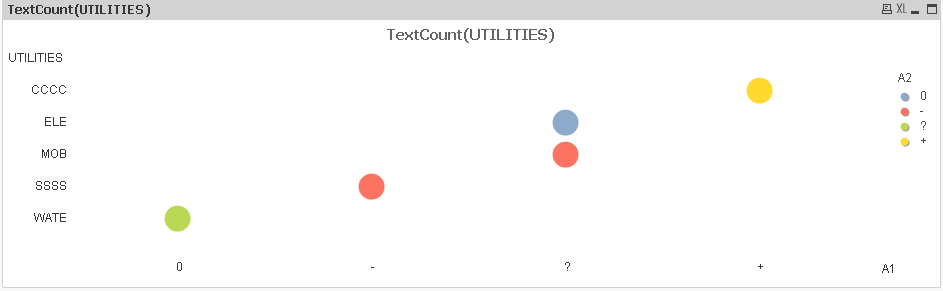
- Mark as New
- Bookmark
- Subscribe
- Mute
- Subscribe to RSS Feed
- Permalink
- Report Inappropriate Content
I am sorry my costumer requires excatlly way Marco has posted.
I saw the video which you had sent me in other thread but i m not getting use advanced options when i click on reply. that is the reason i could not upload any files
Ok, now at least & at last it's clear what your customer requires.
If you read through the very end of the document Sunny has created ('Uploading sample'), it's described that you won't have that advanced editor option from the INBOX.
"Just as a reminder that these options are only available when responding directly on the post. If you are responding from the message inbox from QlikView, you won't see the button for 'Use advanced editor'."
Hence you need to open the thread following the link of the thread, then the advanced editor should be available.
- Mark as New
- Bookmark
- Subscribe
- Mute
- Subscribe to RSS Feed
- Permalink
- Report Inappropriate Content
hi swuel
Yes thats right. i opened it directly from link.
But please can you help me creating the graph whic marco has posted.
- Mark as New
- Bookmark
- Subscribe
- Mute
- Subscribe to RSS Feed
- Permalink
- Report Inappropriate Content
Hi Marco!
This example looks gorgeous!!
Since I have only the Personal Edition , I do not have the permission to open it,
could you be so kind and post how to realize this Grid?.
Im a little newbie on qlik.
Regards!