Unlock a world of possibilities! Login now and discover the exclusive benefits awaiting you.
- Qlik Community
- :
- Forums
- :
- Analytics
- :
- New to Qlik Analytics
- :
- Re: Trying to write expressions but getting error
- Subscribe to RSS Feed
- Mark Topic as New
- Mark Topic as Read
- Float this Topic for Current User
- Bookmark
- Subscribe
- Mute
- Printer Friendly Page
- Mark as New
- Bookmark
- Subscribe
- Mute
- Subscribe to RSS Feed
- Permalink
- Report Inappropriate Content
Trying to write expressions but getting error
I am trying to count the employee, who are above or below the median salary.
The expressions I am using is as follows:
Count({<[CTC]={">="} Median({<[CTC]>} [Employee])
Please help.
- « Previous Replies
- Next Replies »
- Mark as New
- Bookmark
- Subscribe
- Mute
- Subscribe to RSS Feed
- Permalink
- Report Inappropriate Content
Not sure what is M_Grade, but the sample from other post seems to not have that field. For total, it seems to be working
- Mark as New
- Bookmark
- Subscribe
- Mute
- Subscribe to RSS Feed
- Permalink
- Report Inappropriate Content
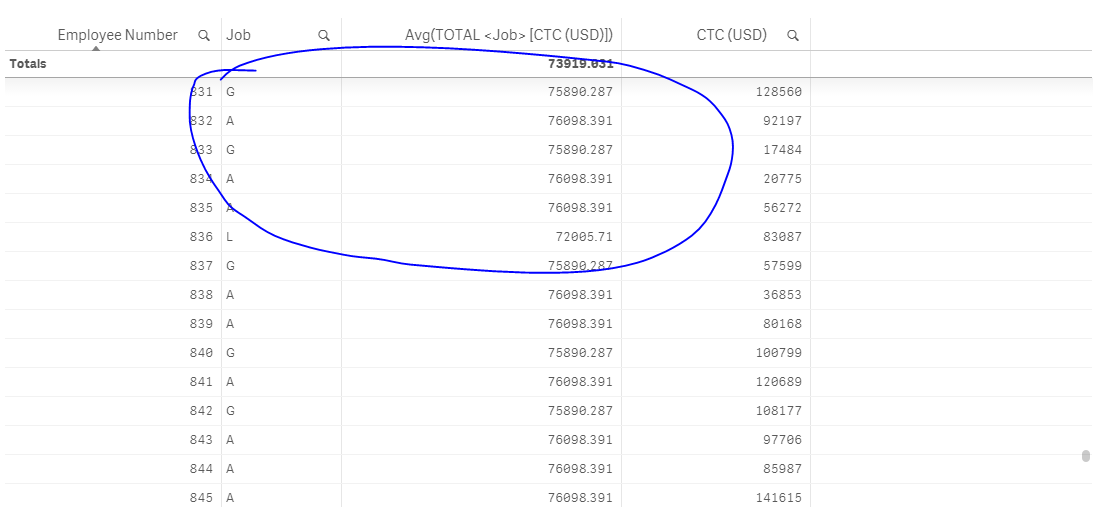
M_Grade = Job in original file. M trying to explain you what I am looking for with the dummy data reference.
Average of total data = 73919, Below average Job "A" count = 147........& expression working fine to get this data and so on....
But what I am looking for is.
Average of Job "A" = 76098, Below average Job "A" count = 154 and so on...
I mean, when I draw a Bar Graph and keep Job at x axis then all Job should have a different averages and below average count will be calculated accordingly..
Hope this clarifies my concern..
- Mark as New
- Bookmark
- Subscribe
- Mute
- Subscribe to RSS Feed
- Permalink
- Report Inappropriate Content
Kaushal would you be able to provide in Excel the exact numbers you would want to see in the bar chart. I think not knowing what you need exactly might be causing the problem.
- Mark as New
- Bookmark
- Subscribe
- Mute
- Subscribe to RSS Feed
- Permalink
- Report Inappropriate Content
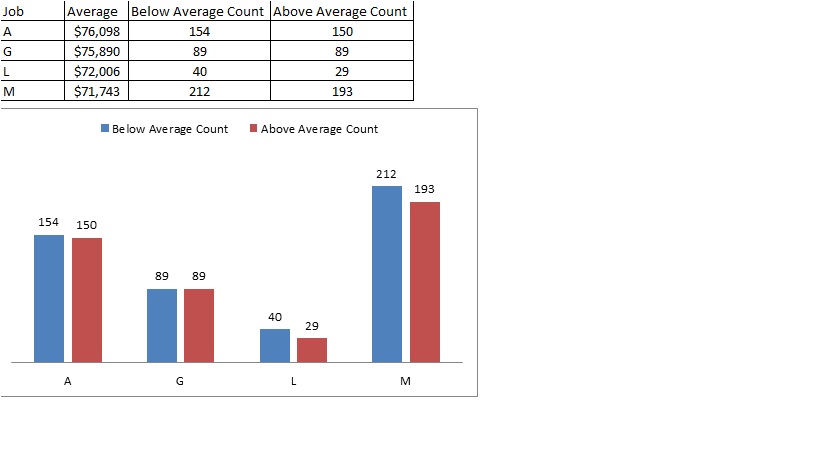
@Sunny: Please refer the above chart & table which is prepared based on the dummy data I have shared.
- Mark as New
- Bookmark
- Subscribe
- Mute
- Subscribe to RSS Feed
- Permalink
- Report Inappropriate Content
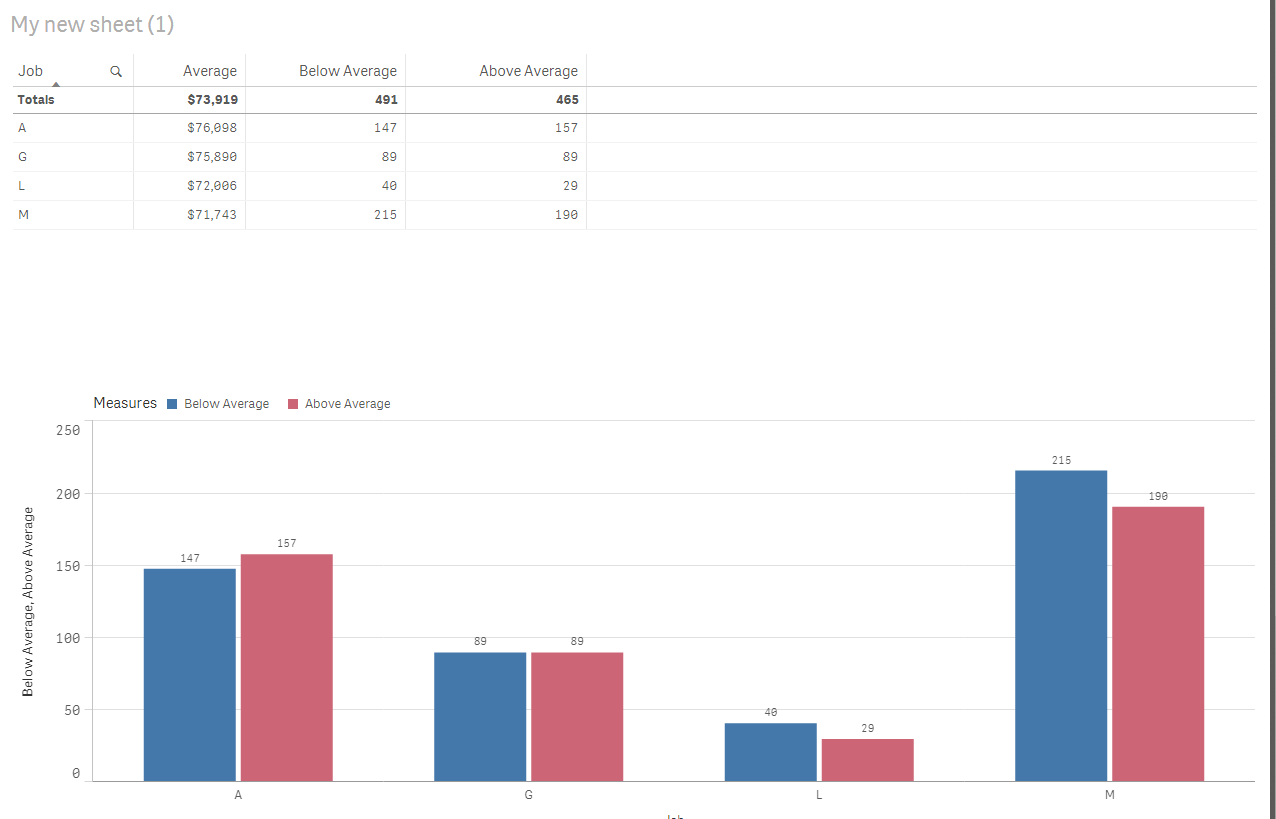
My numbers are slightly off, but here is what I have for you
- « Previous Replies
- Next Replies »