Unlock a world of possibilities! Login now and discover the exclusive benefits awaiting you.
- Qlik Community
- :
- Forums
- :
- Analytics
- :
- New to Qlik Analytics
- :
- Re: Applying selections to a single field with mul...
- Subscribe to RSS Feed
- Mark Topic as New
- Mark Topic as Read
- Float this Topic for Current User
- Bookmark
- Subscribe
- Mute
- Printer Friendly Page
- Mark as New
- Bookmark
- Subscribe
- Mute
- Subscribe to RSS Feed
- Permalink
- Report Inappropriate Content
Applying selections to a single field with multiple responses
Hello!
I'm trying to visualize data where one dimension in the data file is split across three separate fields. To give some context, I work in international development and any given project can be paid for by a combination of different Funders.
This means I have the following fields in my data file:
[Funder 1]
[Funder 2] (sometimes blank)
[Funder 3] (often blank)
Depending on how the data has been entered, a specific "Funder X" could appear in any of the three Funder fields above.
As an end result, in the visualization I'd like a master list of each distinct Funder, which I can use to make selections across all three Funder fields. So selecting "Funder X" will choose records where "Funder X" appears in any of the three Funder fields. Is this possible?
The closest I have been able to come so far is merging the fields together in the load script as below.
"Funder 1" & ' ' & "Funder 2" & ' ' & "Funder 3" as Funder ,
Although this works though search, the Funder list is messy and not that easy to work with.
Any help would be much appreciated!
Thanks,
Jonathan
- « Previous Replies
-
- 1
- 2
- Next Replies »
- Mark as New
- Bookmark
- Subscribe
- Mute
- Subscribe to RSS Feed
- Permalink
- Report Inappropriate Content
You need to create two tables associated using the Record column.
One has the spreadsheet data with all columns except the 3 Funder columns.
The second table has two columns Record and Funder.
This second table will need 3 passes of the spreadsheet to concatenate Funder1 , Funder2 and Funder3 to a single table with the Record field.
Then Sense will associate the Funders column to the other data based on the common Record value.
Something like this... (Note this is not a valid script just an example of the logic)
Data:
load
Record,
Country,
Location,
Date,
ProjectName,
Category....
from Your Spreadsheet ;
Funders:
load
Record,
Funder1 as Funder
from Your Spreadsheet
where trim(Funder1) > ''
concatenate(Funders)
load
Record,
Funder2 as Funder
from Your Spreadsheet
where trim(Funder2) > ''
concatenate(Funders)
load
Record,
Funder3 as Funder
from Your Spreadsheet
where trim(Funder3) > ''
- Mark as New
- Bookmark
- Subscribe
- Mute
- Subscribe to RSS Feed
- Permalink
- Report Inappropriate Content
I agree withisaaclin if you're not wanting to alter the source excels then you will need to initially load the data and then repeat the load for each funder column and give a consistent name to the Funder field in each table, dropping the original table at the end.
Attached is example.
Thanks,
Pete
- Mark as New
- Bookmark
- Subscribe
- Mute
- Subscribe to RSS Feed
- Permalink
- Report Inappropriate Content
Load up the spreadsheet into a single table like:
ProjectData:
LOAD
Record, Country, Location, Project,
[Funder 1], [Funder 2], [Funder 3], Category
FROM
ProjectData.xlsx
(ooxml, embedded labels, table is Sheet1);
Then use a CrossTable load to build a linked table of Funders using the already loaded table as input.
Funders:
CrossTable(FunderSeq, Funder, 1)
LOAD Record,
[Funder 1],
[Funder 2],
[Funder 3]
RESIDENT ProjectData;
DROP FIELD FunderSeq;
Your final model will look like this:
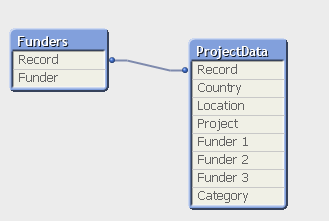
-Rob
- Mark as New
- Bookmark
- Subscribe
- Mute
- Subscribe to RSS Feed
- Permalink
- Report Inappropriate Content
Thanks Rob! This worked perfectly.
Really appreciate all the other great comments and advice. This was my first venture into this community and I didn't expect so much help, so thank you!
Jonathan
- « Previous Replies
-
- 1
- 2
- Next Replies »