Unlock a world of possibilities! Login now and discover the exclusive benefits awaiting you.
- Qlik Community
- :
- All Forums
- :
- QlikView App Dev
- :
- Daily budget & R30 Sales
- Subscribe to RSS Feed
- Mark Topic as New
- Mark Topic as Read
- Float this Topic for Current User
- Bookmark
- Subscribe
- Mute
- Printer Friendly Page
- Mark as New
- Bookmark
- Subscribe
- Mute
- Subscribe to RSS Feed
- Permalink
- Report Inappropriate Content
Daily budget & R30 Sales
Dear Community,
2 questions in one here.
Q1) I'm trying to get a "Daily" budget figure to compare to my sales value.
Sum(Budget) / Day(MonthEnd(DateId)) will give me the figure I'm after, but only for the 1st of each month. I need that value in every day, for the applicable months
Q2) I'd also like a Rolling 30 daily sales average (if possible, in the example data below, utilising the June sales for the July rows that would require it). Accumulate 30 Steps Back won't work because of days with no sales and it won't look back into June.
NOTES:
1) Because of days with no sales (i.e. missing days), the row count does not lend itself to simple Above() expressions.
2) Unchecking the "Suppress zero || missing values" checkbox in Presentation tab is BAD because it shows all possible DateId values, despite selections (i.e. displays every day in my Calendar table)
2) Obviously, there are list box selections elsewhere filtering data, including, but not limited to, a [DateFinYear] field and a [DateMonthName] field which limit the DateId's shown in the straight table chart.
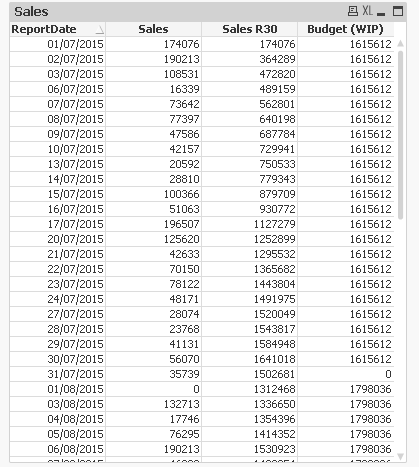
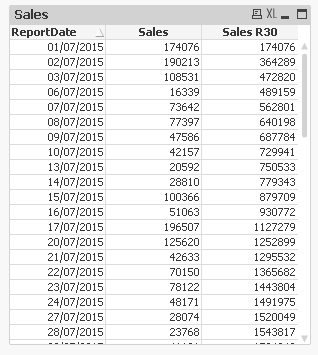
Data looks like this
| DateId | Sales | Sales R30 | Budget |
|---|---|---|---|
| 01/07/2015 | 174076 | 1615612 | |
| 02/07/2015 | 190213 | 0 | |
| 03/07/2015 | 108531 | 0 | |
| 06/07/2015 | 16339 | 0 | |
| 07/07/2015 | 73642 | 0 | |
| 08/07/2015 | 77397 | 0 | |
| 09/07/2015 | 47586 | 0 | |
| 10/07/2015 | 42157 | 0 | |
| 13/07/2015 | 20592 | 0 | |
| 14/07/2015 | 28810 | 0 | |
| 15/07/2015 | 100366 | 0 | |
| 16/07/2015 | 51063 | 0 | |
| 17/07/2015 | 196507 | 0 | |
| 20/07/2015 | 125620 | 0 | |
| 21/07/2015 | 42633 | 0 | |
| 22/07/2015 | 70150 | 0 | |
| 23/07/2015 | 78122 | 0 | |
| 24/07/2015 | 48171 | 0 | |
| 27/07/2015 | 28074 | 0 | |
| 28/07/2015 | 23768 | 0 | |
| 29/07/2015 | 41131 | 0 | |
| 30/07/2015 | 56070 | 0 | |
| 31/07/2015 | 35739 | 0 | |
| 01/08/2015 | 0 | 1798036 | |
| 03/08/2015 | 132713 | 0 | |
| 04/08/2015 | 17746 | 0 | |
| 05/08/2015 | 76295 | 0 | |
| 06/08/2015 | 190213 | 0 | |
| 07/08/2015 | 46328 | 0 | |
| 10/08/2015 | 20778 | 0 | |
| 11/08/2015 | 25368 | 0 | |
| 12/08/2015 | 52215 | 0 | |
| 13/08/2015 | 105767 | 0 | |
| 14/08/2015 | 42198 | 0 | |
| 17/08/2015 | 23729 | 0 | |
| 18/08/2015 | 46284 | 0 | |
| 19/08/2015 | 48306 | 0 | |
| 20/08/2015 | 96869 | 0 | |
| 21/08/2015 | 106274 | 0 | |
| 24/08/2015 | 13890 | 0 | |
| 25/08/2015 | 50361 | 0 | |
| 26/08/2015 | 51593 | 0 | |
| 27/08/2015 | 73950 | 0 | |
| 28/08/2015 | 75884 | 0 | |
| 31/08/2015 | 173326 | 0 | |
| 01/09/2015 | 80487 | 1681866 | |
| 02/09/2015 | 100099 | 0 | |
| 03/09/2015 | 56617 | 0 | |
| 04/09/2015 | 83426 | 0 | |
| 07/09/2015 | 33322 | 0 | |
| 08/09/2015 | 57550 | 0 | |
| 09/09/2015 | 60140 | 0 | |
| 10/09/2015 | 122212 | 0 | |
| 11/09/2015 | 145984 | 0 | |
| 14/09/2015 | 47972 | 0 | |
| 15/09/2015 | 32474 | 0 | |
| 16/09/2015 | 32505 | 0 | |
| 17/09/2015 | 97286 | 0 | |
| 18/09/2015 | 54985 | 0 | |
| 21/09/2015 | 21578 | 0 | |
| 22/09/2015 | 47154 | 0 | |
| 23/09/2015 | 106749 | 0 | |
| 24/09/2015 | 23321 | 0 | |
| 25/09/2015 | 129687 | 0 | |
| 28/09/2015 | 19041 | 0 | |
| 29/09/2015 | 38307 | 0 | |
| 30/09/2015 | 106610 | 0 |
- Mark as New
- Bookmark
- Subscribe
- Mute
- Subscribe to RSS Feed
- Permalink
- Report Inappropriate Content
Accumulate 30 days back can be done very easily with the AsOf Table:The As-Of Table
Table:
LOAD DateId,
Sales,
Budget,
MonthName(DateId) as MonthYear,
'CY' as Flag
FROM
[https://community.qlik.com/thread/219586]
(html, codepage is 1252, embedded labels, table is @1);
LinkTable:
LOAD DateId as ReportDate,
Date(DateId -IterNo()+1) as DateId
Resident Table
While IterNo() <= 30;
Still working on getting the Budget fixed. Somehow it isn't working for the 31st of the month...