Unlock a world of possibilities! Login now and discover the exclusive benefits awaiting you.
- Qlik Community
- :
- Forums
- :
- Analytics
- :
- New to Qlik Analytics
- :
- Re: Combo Chart : compare 2 measures
- Subscribe to RSS Feed
- Mark Topic as New
- Mark Topic as Read
- Float this Topic for Current User
- Bookmark
- Subscribe
- Mute
- Printer Friendly Page
- Mark as New
- Bookmark
- Subscribe
- Mute
- Subscribe to RSS Feed
- Permalink
- Report Inappropriate Content
Combo Chart : compare 2 measures
Hello,
In a combo chart, I would like to compare the sales amount with the target sales amount either per month or per city, for the current year.
Here's my load script:
Sale:
Load * inline
[
SaleID, SaleAmount, SaleYear, SaleMonth, SaleCity, SaleDay
101, 100, 2016, 1, PAR, 10
102, 10, 2016, 1, LON, 11
103, 150, 2016, 3, HEL, 9
104, 210, 2016, 4, FRA, 2
105, 40, 2016, 4, PAR, 13
106, 345, 2016, 8, LON, 21
107, 35, 2016, 8, FRA, 25
];
Target:
Load * inline
[
TargetYear, TargetMonth, TargetCity, TargetAmount
2016, 1, PAR, 20
2016, 1, LON, 30
2016, 2, PAR, 10
2016, 2, LON, 20
2016, 5, HEL, 15
2016, 6, PAR, 10
2016, 6, LON, 20
2016, 7, PAR, 15
2016, 8, PAR, 20
2016, 9, HEL, 15
2016, 10, HEL, 5
2016, 11, HEL, 0
2016, 12, PAR, 15
2016, 12, LON, 25
];
Here's my combo chart with :
- Dimension : SaleMonth
- Measure: Sum( {$<SaleYear = {'2016'}>} SaleAmount)
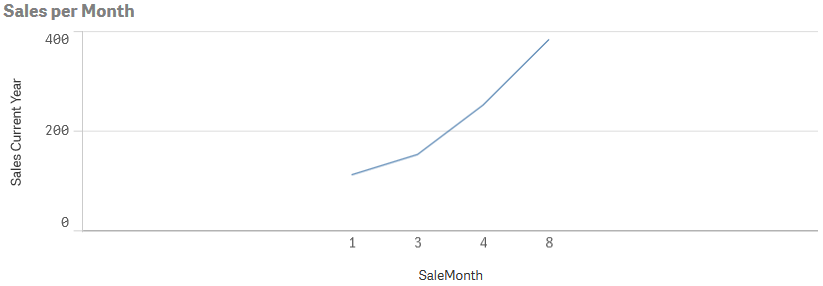
In the same graph I would like to add a second measure which is the sum of the TargetAmount for SaleMonth = TargetMonth and TargetYear = 2016.
Is there an efficient way to achieve this in the UI without changing the load script (I don't want to rename the fields and I want to avoid synthetic keys...)?
Many thanks.
Annick
- Tags:
- combo chart
- targets
Accepted Solutions
- Mark as New
- Bookmark
- Subscribe
- Mute
- Subscribe to RSS Feed
- Permalink
- Report Inappropriate Content
Is there an efficient way to achieve this in the UI without changing the load script
No. A chart can have only one dimension per axis. You cannot use both SaleMonth and TargetMonth as dimensions for the x-axis in the same chart.
talk is cheap, supply exceeds demand