Unlock a world of possibilities! Login now and discover the exclusive benefits awaiting you.
- Qlik Community
- :
- All Forums
- :
- QlikView App Dev
- :
- Re: How can I create table with two different tota...
- Subscribe to RSS Feed
- Mark Topic as New
- Mark Topic as Read
- Float this Topic for Current User
- Bookmark
- Subscribe
- Mute
- Printer Friendly Page
- Mark as New
- Bookmark
- Subscribe
- Mute
- Subscribe to RSS Feed
- Permalink
- Report Inappropriate Content
How can I create table with two different total by one dimension?
Hi,
I have troubling with following table
I need calculate total for period (January-June) for each year, in next month this period would be January-July and so on
After that column I need to calculate common total. Is it real?
Thanks in advance for any help with this!
| Dimension | January | February | March | April | May | June | July | August | September | October | November | December | Total Jan-June | Total |
|---|---|---|---|---|---|---|---|---|---|---|---|---|---|---|
| 2014 | 1 799 547 | 1 721 240 | 2 093 046 | 2 149 250 | 1 522 004 | 1 543 925 | 1 703 242 | 1 808 487 | 2 168 388 | 2 242 077 | 2 306 344 | 3 295 807 | 10 829 052 | 24 353 357 |
| 2015 | 1 883 872 | 1 967 769 | 2 030 353 | 1 869 634 | 1 502 336 | 1 467 124 | 1 652 968 | 1 712 512 | 2 211 050 | 2 403 881 | 2 522 071 | 3 288 683 | 10 721 088 | 24 512 253 |
| 2016 | 1 128 410 | 1 675 000 | 1 562 004 | 2 009 250 | 1 599 547 | 164 000 | 6 538 664 | 6 538 664 |
Accepted Solutions
- Mark as New
- Bookmark
- Subscribe
- Mute
- Subscribe to RSS Feed
- Permalink
- Report Inappropriate Content
Yes, that's possible. It's easiest to create new field for this in the script:
Periods:
LOAD * INLINE [
Period, Month
January, January
February, February,
....etc
December, December
Total Jan-June, January
Total Jan-June, February
...etc
Total Jan-June, June
Total, January
Total, February,
....etc
Total, December
];
Then use the new Period field instead of Month as dimension in your pivot table.
talk is cheap, supply exceeds demand
- Mark as New
- Bookmark
- Subscribe
- Mute
- Subscribe to RSS Feed
- Permalink
- Report Inappropriate Content
Hi Nick!
May be the solution of Gysbert is better than mine! But...
If you don't want to work on the scrip, I would suggest two chart-tables:
One first: a pivot table with Year and Month as dimensions and the expression =Sum(values). Feel free to mark "Show Partial Sums" to both dimensions (on Presentation tab) to see the totals. Example:

One second: a Straight Table with Year as the only dimension and the following expressions:
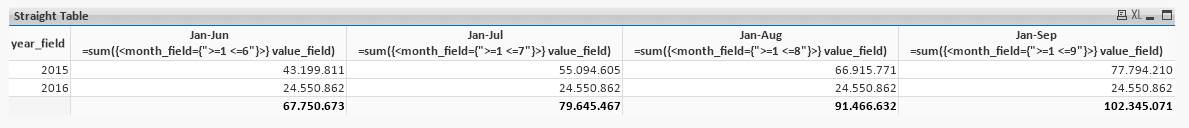
As you can see, I have used set analysis to set the intervals of months.
Hope it helps!
Best regards,
Marcello
- Mark as New
- Bookmark
- Subscribe
- Mute
- Subscribe to RSS Feed
- Permalink
- Report Inappropriate Content
Thank you all very much!