Unlock a world of possibilities! Login now and discover the exclusive benefits awaiting you.
- Qlik Community
- :
- All Forums
- :
- QlikView App Dev
- :
- Re: How to combine values from the same column int...
- Subscribe to RSS Feed
- Mark Topic as New
- Mark Topic as Read
- Float this Topic for Current User
- Bookmark
- Subscribe
- Mute
- Printer Friendly Page
- Mark as New
- Bookmark
- Subscribe
- Mute
- Subscribe to RSS Feed
- Permalink
- Report Inappropriate Content
How to combine values from the same column into one condition
Hello all,
I've been working in QlikView for a while now. I have a question about a certain column I've been working with. I have a table called 'Jobs' that counts all the jobs my company's won for our client. One of the columns is Status. Status has three possible values: Lost, Won, and Inactive.
I've been asked to create a bar chart that measures Won jobs vs the other two possible values (Lost and Inactive) by Salesperson. Can anyone help me with an expression I can use for this? I need to somehow combine Lost and Inactive Jobs into one bar.
The expression would be something like
NumericCount(Status, if(Status === 'Lost' OR Status === 'Inactive), 'Other Jobs', 'Won Jobs')
but it doesn't seem to be working.
- « Previous Replies
-
- 1
- 2
- Next Replies »
- Mark as New
- Bookmark
- Subscribe
- Mute
- Subscribe to RSS Feed
- Permalink
- Report Inappropriate Content
You can try using a calculated dimension:
If(Status = 'Won', 'Won Jobs', 'Other Jobs')
- Mark as New
- Bookmark
- Subscribe
- Mute
- Subscribe to RSS Feed
- Permalink
- Report Inappropriate Content
Thanks Sunny. But how can I implement this if I wanted to count the number of jobs?
I tried TextCount(If(Status = 'Won', 'Won Jobs', 'Other Jobs')), and this didn't work. Any pointers for modifying it to work with TextCount?
- Mark as New
- Bookmark
- Subscribe
- Mute
- Subscribe to RSS Feed
- Permalink
- Report Inappropriate Content
Just use Count(Status) as your expression and If(Status = 'Won', 'Won Jobs', 'Other Jobs') as your dimension
- Mark as New
- Bookmark
- Subscribe
- Mute
- Subscribe to RSS Feed
- Permalink
- Report Inappropriate Content
This way?

- Mark as New
- Bookmark
- Subscribe
- Mute
- Subscribe to RSS Feed
- Permalink
- Report Inappropriate Content
Yes, just like this! But how did you get this chart to pop up? What was the expression that you used?
- Mark as New
- Bookmark
- Subscribe
- Mute
- Subscribe to RSS Feed
- Permalink
- Report Inappropriate Content
Please see attached. !
Expressions Used:
=Aggr(Count({$<Status={'Won'}>}Job),SalesPerson) - 'Won ' Jobs Count
=Aggr(Count({$<Status={'*'}-{'Won'}>}Job),SalesPerson) - 'Rest' Jobs Count
- Mark as New
- Bookmark
- Subscribe
- Mute
- Subscribe to RSS Feed
- Permalink
- Report Inappropriate Content
I prefer stalwar1 solution as simple to understand.
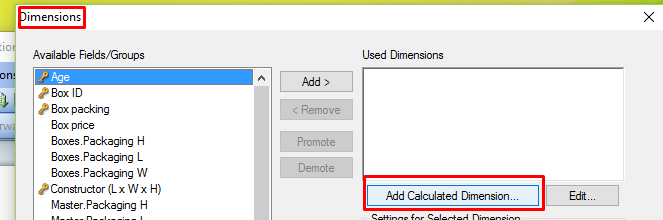
Open Bar chart properties. Right click on the chart > Properties.
1. Just in Calculated dimension write the expression:
If(Status = 'Won', 'Won Jobs', 'Other Jobs')
2. Add in expression field this statement:
Count(Status)

- Mark as New
- Bookmark
- Subscribe
- Mute
- Subscribe to RSS Feed
- Permalink
- Report Inappropriate Content
AFAIK,calculated dimensions usually have a big impact on performance (especially with huge data). use of set analysis for restrictions over IF() stements is recommended ,especially in charts .
- Mark as New
- Bookmark
- Subscribe
- Mute
- Subscribe to RSS Feed
- Permalink
- Report Inappropriate Content
That's true, then I would suggest creating a field in the script only.
LOAD Status,
If(Status = 'Won', 'Won', 'Rest') as New_Status
Resident Table;
and then use New_Status as Dimension and Count(New_Status) as your expression.
Alternatively, I don't understand the usage of Aggr() in your solution. Why not just use these?
=Count({$<Status={'Won'}>}Job)
=Count({$<Status={'*'}-{'Won'}>}Job)
- « Previous Replies
-
- 1
- 2
- Next Replies »