Unlock a world of possibilities! Login now and discover the exclusive benefits awaiting you.
- Qlik Community
- :
- Forums
- :
- Analytics
- :
- New to Qlik Analytics
- :
- Re: Title Stacked Bar and Period percentage
- Subscribe to RSS Feed
- Mark Topic as New
- Mark Topic as Read
- Float this Topic for Current User
- Bookmark
- Subscribe
- Mute
- Printer Friendly Page
- Mark as New
- Bookmark
- Subscribe
- Mute
- Subscribe to RSS Feed
- Permalink
- Report Inappropriate Content
Title Stacked Bar and Period percentage
Question 1
I want to show a bar chart and by selecting a period (ReportDate) the title of the bar chart need to change with the selecting period.
Example:
ReportDate
20151231
20160131
20160229
20160331
Title:
Credit rating period: 20151231
By selecting the ReportDate 20160131 the title has to change in:
Credit rating period: 20160131
What formula in Qlik Sense can I use?
Question 2
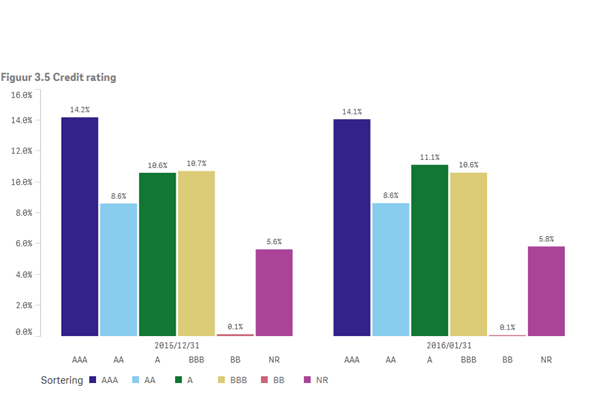
How can I display the percentages of each ReportDate to 100%. Now it is showing for each period the percentage of the total of all the values for the periods 20151231, 20160131.
What formula can I use in Qlik Sense?
- « Previous Replies
-
- 1
- 2
- Next Replies »
- Mark as New
- Bookmark
- Subscribe
- Mute
- Subscribe to RSS Feed
- Permalink
- Report Inappropriate Content
I think you changed from grouped bars to stacked bars. I don't really know Qlik Sense well enough to provide an answer for this without playing around with it. May be Chandrasheker or reddys310 can help here
- Mark as New
- Bookmark
- Subscribe
- Mute
- Subscribe to RSS Feed
- Permalink
- Report Inappropriate Content
Hi,
In qliksense once you stack your measures it will total and display as label but once you put the pointer on the stacked bar it will display the separate measures and percentages... If you put as a group then all the measures will appear separately ... This is just how the appearance of the chart in qliksense nothing to do with the formula..
Thanks
- Mark as New
- Bookmark
- Subscribe
- Mute
- Subscribe to RSS Feed
- Permalink
- Report Inappropriate Content
Hi,
Please mark the response as helpful or correct answer so that it will help the other members of the community to refer and not to spend more time over the post...
Thanks
- Mark as New
- Bookmark
- Subscribe
- Mute
- Subscribe to RSS Feed
- Permalink
- Report Inappropriate Content
Hi Xandro,
Question1 : you can make use of getfieldselections() in the title function to achieve this.
ex:getfieldselections([`Date Status`])
Question 2 : make use of a stacked bar chart which will show the over all total as 100% and when you hover over the segments you will be able to find the segment %s.
- « Previous Replies
-
- 1
- 2
- Next Replies »