Unlock a world of possibilities! Login now and discover the exclusive benefits awaiting you.
- Qlik Community
- :
- All Forums
- :
- QlikView App Dev
- :
- Re: show % instead of total on bar chart
- Subscribe to RSS Feed
- Mark Topic as New
- Mark Topic as Read
- Float this Topic for Current User
- Bookmark
- Subscribe
- Mute
- Printer Friendly Page
- Mark as New
- Bookmark
- Subscribe
- Mute
- Subscribe to RSS Feed
- Permalink
- Report Inappropriate Content
show % instead of total on bar chart
Hello
I'm look for a solution to display % instead of total value on ca bar chart.
For example,
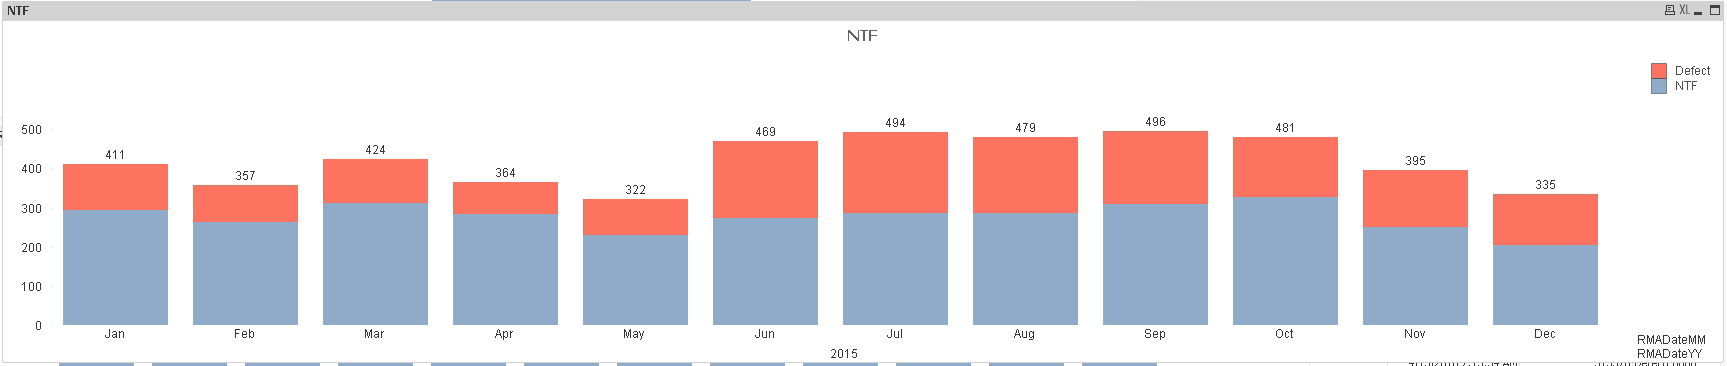
There are two expressions. Red one shows the total count of defects found, while gray shows the count of not problem found.
If I turn on "Values on Data Points" option, the bar chart shows total of value of red count plus gray count.
How can I make it show the percentage of red out of gray?
Thanks,
Josh
- Tags:
- qlikview_scripting
Accepted Solutions
- Mark as New
- Bookmark
- Subscribe
- Mute
- Subscribe to RSS Feed
- Permalink
- Report Inappropriate Content
Hi,
You have to create 2 expressions for each category. the category that you want to show %, you need to use Dual function with Num format as %.
It can be shown as % but only when value is plotted inside segment, when value on top, it's still showing as number.
Please see the attached file.
- Mark as New
- Bookmark
- Subscribe
- Mute
- Subscribe to RSS Feed
- Permalink
- Report Inappropriate Content
It works great!
Thanks,
Josh