Unlock a world of possibilities! Login now and discover the exclusive benefits awaiting you.
- Qlik Community
- :
- Forums
- :
- Analytics
- :
- New to Qlik Analytics
- :
- Re: Displaying KPIs for Forecast Variance
- Subscribe to RSS Feed
- Mark Topic as New
- Mark Topic as Read
- Float this Topic for Current User
- Bookmark
- Subscribe
- Mute
- Printer Friendly Page
- Mark as New
- Bookmark
- Subscribe
- Mute
- Subscribe to RSS Feed
- Permalink
- Report Inappropriate Content
Displaying KPIs for Forecast Variance
I have the following sample dataset.
| Date | Forecasted Value | Actual Value | Difference | Mod(Difference) | Mod(Difference)/Forecasted Value as % |
|---|---|---|---|---|---|
| 1-Jan-16 | 11 | 1 | 10 | 10 | 91% |
| 2-Jan-16 | 10 | 2 | 8 | 8 | 80% |
| 3-Jan-16 | 9 | 3 | 6 | 6 | 67% |
| 4-Jan-16 | 8 | 4 | 4 | 4 | 50% |
| 5-Jan-16 | 7 | 5 | 2 | 2 | 29% |
| 6-Jan-16 | 6 | 6 | 0 | 0 | 0% |
| 7-Jan-16 | 5 | 7 | -2 | 2 | 40% |
| 8-Jan-16 | 4 | 8 | -4 | 4 | 100% |
| 9-Jan-16 | 3 | 9 | -6 | 6 | 200% |
| 10-Jan-16 | 2 | 10 | -8 | 8 | 400% |
| 11-Jan-16 | 1 | 11 | -10 | 10 | 1000% |
| Sum | 66 | 66 | 0 | 60 |
I want to include the following calculation results as KPIs (Please review the attached excel for complete formula details)
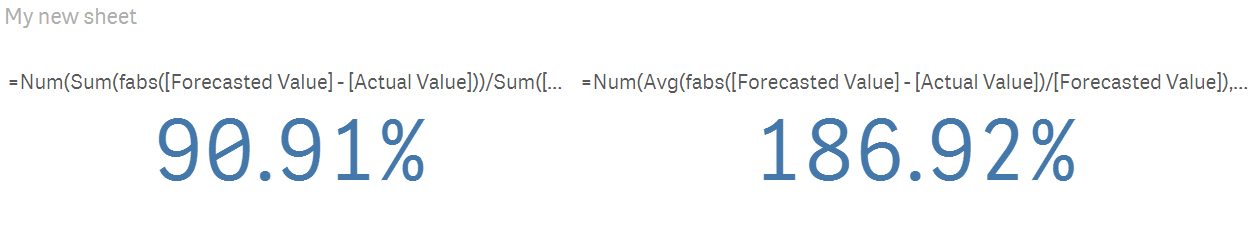
Overall % Variance calculated based on Sum(Mod(Variance)) / Sum(Forecasted Value) - 90.91%
Average % Variance calculated based on Average(Sum(Mod(Difference)/Forecasted Value)) - 186.92%
What should be the calculation for displaying the above values as KPIs?
Thanks in advance.
- Mark as New
- Bookmark
- Subscribe
- Mute
- Subscribe to RSS Feed
- Permalink
- Report Inappropriate Content
Overall % looks good to me, you jut need to use fabs to find the absolute value for variance -> Sum(fabs(Variance))/Sum([Forecasted Value])
or this if Variance is calculated as well:
Sum(fabs([Forecasted Value] - [Actual Value]))/Sum([Forecasted Value])
- Mark as New
- Bookmark
- Subscribe
- Mute
- Subscribe to RSS Feed
- Permalink
- Report Inappropriate Content
The Average % can be calculated using this:
=Num(Avg(fabs([Forecasted Value] - [Actual Value])/[Forecasted Value]), '##.00%')
Overall%
=Num(Sum(fabs([Forecasted Value] - [Actual Value]))/Sum([Forecasted Value]), '##.00%')
- Mark as New
- Bookmark
- Subscribe
- Mute
- Subscribe to RSS Feed
- Permalink
- Report Inappropriate Content
Thank you, I will check it and will respond back over the weekend.