Unlock a world of possibilities! Login now and discover the exclusive benefits awaiting you.
- Qlik Community
- :
- Forums
- :
- Analytics
- :
- New to Qlik Analytics
- :
- Re: Distribution Question
- Subscribe to RSS Feed
- Mark Topic as New
- Mark Topic as Read
- Float this Topic for Current User
- Bookmark
- Subscribe
- Mute
- Printer Friendly Page
- Mark as New
- Bookmark
- Subscribe
- Mute
- Subscribe to RSS Feed
- Permalink
- Report Inappropriate Content
Distribution Question
Hello.
I am new to Qlik, so please be gentle with me!
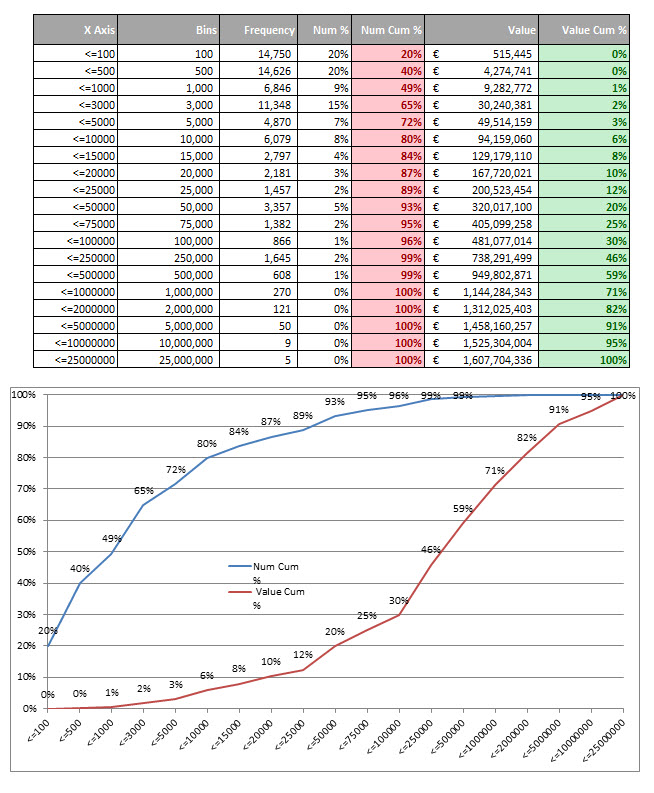
I have a file of data, about 70K lines. Each line is a transaction with a value in €
I want to show the distribution of the number of orders relative to the value (80:20 Rule)
I can do this in Excel using Frequency array formula to get the number of orders for each bin, and sumif( to get the value for each bin.
This gives the two lines I need to show (see graph)
My question is simple, but I suspect the answer may not be, how can I do this in Qlik Sense from the data? I have tried various ways but all fail ~ can anyone help
Thanks
Accepted Solutions
- Mark as New
- Bookmark
- Subscribe
- Mute
- Subscribe to RSS Feed
- Permalink
- Report Inappropriate Content
May be like this. Script:
Table:
LOAD [Working Price],
If([Working Price] <= 100, Dual('<=100', 1),
If([Working Price] <= 500, Dual('<=500', 2),
If([Working Price] <= 1000, Dual('<=1000', 3),
If([Working Price] <= 3000, Dual('<=3000', 4),
If([Working Price] <= 5000, Dual('<=5000', 5),
If([Working Price] <= 10000, Dual('<=10000', 6),
If([Working Price] <= 15000, Dual('<=15000', 7),
If([Working Price] <= 20000, Dual('<=20000', 8),
If([Working Price] <= 25000, Dual('<=25000', 9),
If([Working Price] <= 50000, Dual('<=50000', 10),
If([Working Price] <= 75000, Dual('<=75000', 11),
If([Working Price] <= 100000, Dual('<=100000', 12),
If([Working Price] <= 250000, Dual('<=250000', 13),
If([Working Price] <= 500000, Dual('<=500000', 14),
If([Working Price] <= 1000000, Dual('<=1000000', 15),
If([Working Price] <= 2000000, Dual('<=2000000', 16),
If([Working Price] <= 5000000, Dual('<=5000000', 17),
If([Working Price] <= 10000000, Dual('<=10000000', 18),
If([Working Price] <= 25000000, Dual('<=25000000', 19)))))))))))))))))))) as Bin
FROM
[sample data.xlsx]
(ooxml, embedded labels, table is Sheet1);
Line chart
Dimension
Bin
Expressions
1) =RangeSum(Above(Sum([Working Price]), 0, RowNo()))/Sum(TOTAL [Working Price])
2) =RangeSum(Above(Count([Working Price]), 0, RowNo()))/Count(TOTAL [Working Price])
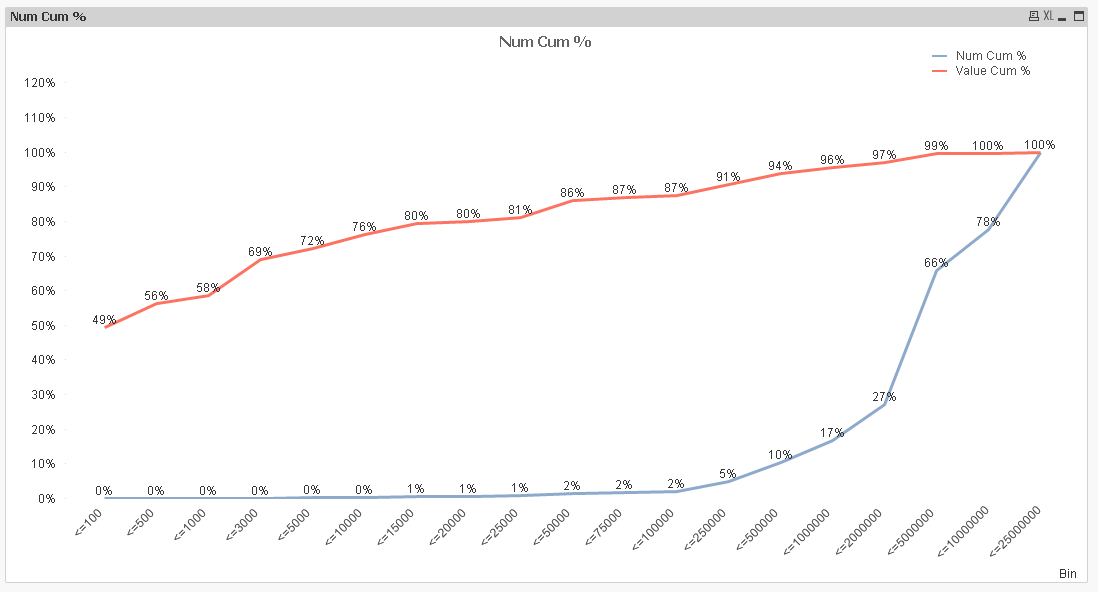
I calculated Bin in the script, but can be done dynamically on the front end as well.
- Mark as New
- Bookmark
- Subscribe
- Mute
- Subscribe to RSS Feed
- Permalink
- Report Inappropriate Content
Would you be able to share the excel file here and may be let us know which of the columns need to be calculated in Qlik Sense?
- Mark as New
- Bookmark
- Subscribe
- Mute
- Subscribe to RSS Feed
- Permalink
- Report Inappropriate Content
Hi
The columns I want to plot is the Pink (Num Cum %) and Green (Value Cum %)
The chart I want is shown in my original post
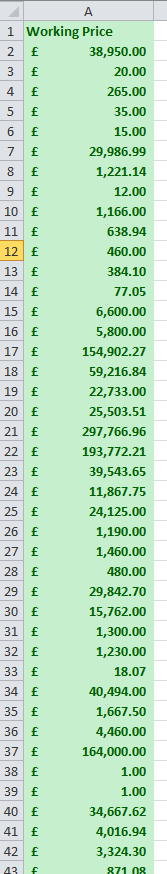
enclosed is a sample of the data, it is a list of values
thanks for your help
- Mark as New
- Bookmark
- Subscribe
- Mute
- Subscribe to RSS Feed
- Permalink
- Report Inappropriate Content
Can you post the data in Excel format? Images require me to manually enter all the data into QlikView. If you need directions on how to upload files to community, check this out -> Uploading a Sample
- Mark as New
- Bookmark
- Subscribe
- Mute
- Subscribe to RSS Feed
- Permalink
- Report Inappropriate Content
Sorry here is a sample of my data
thanks
- Mark as New
- Bookmark
- Subscribe
- Mute
- Subscribe to RSS Feed
- Permalink
- Report Inappropriate Content
May be like this. Script:
Table:
LOAD [Working Price],
If([Working Price] <= 100, Dual('<=100', 1),
If([Working Price] <= 500, Dual('<=500', 2),
If([Working Price] <= 1000, Dual('<=1000', 3),
If([Working Price] <= 3000, Dual('<=3000', 4),
If([Working Price] <= 5000, Dual('<=5000', 5),
If([Working Price] <= 10000, Dual('<=10000', 6),
If([Working Price] <= 15000, Dual('<=15000', 7),
If([Working Price] <= 20000, Dual('<=20000', 8),
If([Working Price] <= 25000, Dual('<=25000', 9),
If([Working Price] <= 50000, Dual('<=50000', 10),
If([Working Price] <= 75000, Dual('<=75000', 11),
If([Working Price] <= 100000, Dual('<=100000', 12),
If([Working Price] <= 250000, Dual('<=250000', 13),
If([Working Price] <= 500000, Dual('<=500000', 14),
If([Working Price] <= 1000000, Dual('<=1000000', 15),
If([Working Price] <= 2000000, Dual('<=2000000', 16),
If([Working Price] <= 5000000, Dual('<=5000000', 17),
If([Working Price] <= 10000000, Dual('<=10000000', 18),
If([Working Price] <= 25000000, Dual('<=25000000', 19)))))))))))))))))))) as Bin
FROM
[sample data.xlsx]
(ooxml, embedded labels, table is Sheet1);
Line chart
Dimension
Bin
Expressions
1) =RangeSum(Above(Sum([Working Price]), 0, RowNo()))/Sum(TOTAL [Working Price])
2) =RangeSum(Above(Count([Working Price]), 0, RowNo()))/Count(TOTAL [Working Price])
I calculated Bin in the script, but can be done dynamically on the front end as well.
- Mark as New
- Bookmark
- Subscribe
- Mute
- Subscribe to RSS Feed
- Permalink
- Report Inappropriate Content
Sunny
Thanks for your help it works brilliantly
