Unlock a world of possibilities! Login now and discover the exclusive benefits awaiting you.
- Qlik Community
- :
- All Forums
- :
- QlikView App Dev
- :
- Re: Accumulated Distinct Count
- Subscribe to RSS Feed
- Mark Topic as New
- Mark Topic as Read
- Float this Topic for Current User
- Bookmark
- Subscribe
- Mute
- Printer Friendly Page
- Mark as New
- Bookmark
- Subscribe
- Mute
- Subscribe to RSS Feed
- Permalink
- Report Inappropriate Content
Accumulated Distinct Count
Hi all,
Any idea how to get accumulated distinct count ?
Column Count is the result that I need to receive in QlikView.
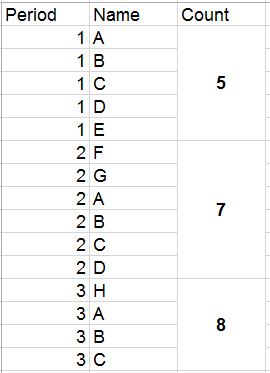
Distinct Count for period 1 = 5,
Distinct Count for period 1+2 =7
Distinct Count for period 1+2+3 = 8
Thanks for your help.
- « Previous Replies
-
- 1
- 2
- Next Replies »
Accepted Solutions
- Mark as New
- Bookmark
- Subscribe
- Mute
- Subscribe to RSS Feed
- Permalink
- Report Inappropriate Content
I don't think a set analysis solution will really work here, since set analysis is only evaluated once per chart.
You can create an expression with a set expression for every period (like emulating the as of table in the front end), but I wouldn't do this.
Depending on your data model, you might be able to make use of the DISTINCTness of the aggr() function, so this might work without a change to your original data model:
| Period | Count(Aggr(Name,Name)) |
|---|---|
| 8 | |
| 1 | 5 |
| 2 | 7 |
| 3 | 8 |
[full accumulation enabled in the expression settings.]
See attached a sample for both options.
- Mark as New
- Bookmark
- Subscribe
- Mute
- Subscribe to RSS Feed
- Permalink
- Report Inappropriate Content
For example like this:
INPUT:
LOAD * INLINE [
Period, Name
1,A
1,B
1,C
1,D
1,E
2,F
2,G
2,A
2,B
2,C
2,D
3,H
3,A
3,B
3,C
];
LOAD DISTINCT Period as PeriodAsOF, iterno() as Period
RESIDENT INPUT
WHILE IterNo() <= Period;
| PeriodAsOF | COUNT(DISTINCT Name) |
|---|---|
| 8 | |
| 1 | 5 |
| 2 | 7 |
| 3 | 8 |
- Mark as New
- Bookmark
- Subscribe
- Mute
- Subscribe to RSS Feed
- Permalink
- Report Inappropriate Content
Is it possible to get that result without using script? Using Straight Table for example with set analysis?
- Mark as New
- Bookmark
- Subscribe
- Mute
- Subscribe to RSS Feed
- Permalink
- Report Inappropriate Content
The script is only preparing the AsOf Table for the Periods (Don't get mislead by the DISTINCT keyword, there are also other approaches to create the same table as shown in the blog post).
I believe using the AsOf table would be the easiest approach (and the table can also be used for other accumulations, see the examples in the blog post).
Why do you want a front end only solution?
- Mark as New
- Bookmark
- Subscribe
- Mute
- Subscribe to RSS Feed
- Permalink
- Report Inappropriate Content
I don't think a set analysis solution will really work here, since set analysis is only evaluated once per chart.
You can create an expression with a set expression for every period (like emulating the as of table in the front end), but I wouldn't do this.
Depending on your data model, you might be able to make use of the DISTINCTness of the aggr() function, so this might work without a change to your original data model:
| Period | Count(Aggr(Name,Name)) |
|---|---|
| 8 | |
| 1 | 5 |
| 2 | 7 |
| 3 | 8 |
[full accumulation enabled in the expression settings.]
See attached a sample for both options.
- Mark as New
- Bookmark
- Subscribe
- Mute
- Subscribe to RSS Feed
- Permalink
- Report Inappropriate Content
thanks swuehl. It works. Is there any way not to use 'Full accumulation' and get that result? Cause when I want to sort by Period descending results are no longer correct.
- Mark as New
- Bookmark
- Subscribe
- Mute
- Subscribe to RSS Feed
- Permalink
- Report Inappropriate Content
The AsOf table approach will handle these kind of issues correctly.
- Mark as New
- Bookmark
- Subscribe
- Mute
- Subscribe to RSS Feed
- Permalink
- Report Inappropriate Content
Thomas,
Try rangesum(above(sum( aggr( rangesum( count(distinct "Name"))),"Name")),0,RowNo()))
referenced from: Count Distinct Accumulation in Qlik Sense
You will need to sort your table descending in the load script though and sort your chart descending to get the right numbers.
- Mark as New
- Bookmark
- Subscribe
- Mute
- Subscribe to RSS Feed
- Permalink
- Report Inappropriate Content
Hi Stefan,
I used your useful tip for this issue. I applied it in the following line chart expression:
aggr(rangesum(above(num(count({<Month={'<=$(=max(Month))'}>}aggr(distinct Name,Name),'#.##0'),0,RowNo()),Month))
I can not realise why this expression works well on my local pc, while it changes dramatically when published on the access point.
Did you notice similar issues?
Thanks
M
- Mark as New
- Bookmark
- Subscribe
- Mute
- Subscribe to RSS Feed
- Permalink
- Report Inappropriate Content
The aggr() function sorts its dimensional values by load order by default.
You need to ensure that Month is in correct load order (i.e. it must be chronological load order) or you need to use
- « Previous Replies
-
- 1
- 2
- Next Replies »