Unlock a world of possibilities! Login now and discover the exclusive benefits awaiting you.
- Qlik Community
- :
- All Forums
- :
- QlikView App Dev
- :
- Re: min of max calculation
- Subscribe to RSS Feed
- Mark Topic as New
- Mark Topic as Read
- Float this Topic for Current User
- Bookmark
- Subscribe
- Mute
- Printer Friendly Page
- Mark as New
- Bookmark
- Subscribe
- Mute
- Subscribe to RSS Feed
- Permalink
- Report Inappropriate Content
min of max calculation
If I have the dimension of customer, and the two measures of Sales value and Date.
How in a table grouped at Customer level can I show the minimum date WHERE the sales value is the maximum, ie the same sales value could repeat across dates and I want the earliest that the max has occured.
I have tried to manipulate an AGGR function but to no avail
Is there a way of doing this without changing the load script
For example if i have the raw data below
| Customer | Sales | Date |
| A | 50 | 10/12/2015 |
| A | 100 | 09/12/2015 |
| A | 100 | 08/12/2015 |
| B | 75 | 10/12/2015 |
| B | 100 | 09/12/2015 |
| B | 150 | 08/12/2015 |
I want this table chart in my Qlikview app so for customer A, the max sales is 100, which occurs on two days and in this case i want the earlies date.
| Customer | MAX(Sales) | Min(Date) |
| A | 100 | 08/12/2015 |
| B | 150 | 08/12/2015 |
Accepted Solutions
- Mark as New
- Bookmark
- Subscribe
- Mute
- Subscribe to RSS Feed
- Permalink
- Report Inappropriate Content
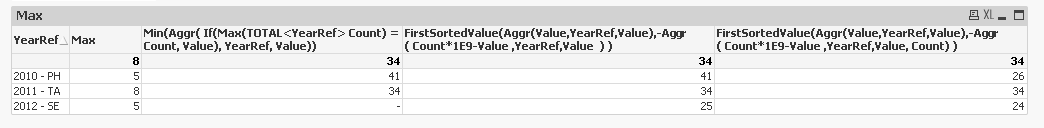
Slightly modifiying Stefan's expression:
FirstSortedValue(Aggr(Value,YearRef,Value),-Aggr( Count*1E9-Value ,YearRef,Value, Count))
- Mark as New
- Bookmark
- Subscribe
- Mute
- Subscribe to RSS Feed
- Permalink
- Report Inappropriate Content
Using your sample data:
SET DateFormat ='DD/MM/YYYY';


 LOAD * INLINE [
Customer,Sales,Date
A,50,10/12/2015
A,100,09/12/2015
A,100,08/12/2015
B,75,10/12/2015
B,100,09/12/2015
B,150,08/12/2015
];
| Customer | Max(Sales) | FirstSortedValue(Aggr(Date,Customer,Date),-Aggr( Sales*1E9-Date,Customer,Date) ) |
|---|---|---|
| 150 | 08/12/2015 | |
| A | 100 | 08/12/2015 |
| B | 150 | 08/12/2015 |
or
| Customer | Max(Sales) | Date(Min(Aggr( If(Max(TOTAL<Customer> Sales) =Sales, Date), Customer, Date))) |
|---|---|---|
| 150 | 08/12/2015 | |
| A | 100 | 08/12/2015 |
| B | 150 | 08/12/2015 |
- Mark as New
- Bookmark
- Subscribe
- Mute
- Subscribe to RSS Feed
- Permalink
- Report Inappropriate Content
Hi
Thanks a lot for your reply - I have looked at these formulas and they work the majority of the time however there are a few occasions when it falls down.
So I probably wasn't totally clear in my initial question, I have attached a set of sample data - what I want to show is the "value" which is flagged by the arrows, currently where there are multiple "values" which are the same the calculation falls down.
Is there a way around this?
- Mark as New
- Bookmark
- Subscribe
- Mute
- Subscribe to RSS Feed
- Permalink
- Report Inappropriate Content
I think you just need to add the Count field to the aggr() dimensions
- Mark as New
- Bookmark
- Subscribe
- Mute
- Subscribe to RSS Feed
- Permalink
- Report Inappropriate Content
Slightly modifiying Stefan's expression:
FirstSortedValue(Aggr(Value,YearRef,Value),-Aggr( Count*1E9-Value ,YearRef,Value, Count))
- Mark as New
- Bookmark
- Subscribe
- Mute
- Subscribe to RSS Feed
- Permalink
- Report Inappropriate Content
Cheers guys 
- Mark as New
- Bookmark
- Subscribe
- Mute
- Subscribe to RSS Feed
- Permalink
- Report Inappropriate Content
What's the difference to the expression I suggested  ?
?