Unlock a world of possibilities! Login now and discover the exclusive benefits awaiting you.
- Qlik Community
- :
- Forums
- :
- Analytics
- :
- New to Qlik Analytics
- :
- Re: How Do I set different background colors based...
- Subscribe to RSS Feed
- Mark Topic as New
- Mark Topic as Read
- Float this Topic for Current User
- Bookmark
- Subscribe
- Mute
- Printer Friendly Page
- Mark as New
- Bookmark
- Subscribe
- Mute
- Subscribe to RSS Feed
- Permalink
- Report Inappropriate Content
How Do I set different background colors based on column label and value within that column?
Ok, so I'm new to Qlikview Sense so bear with me.
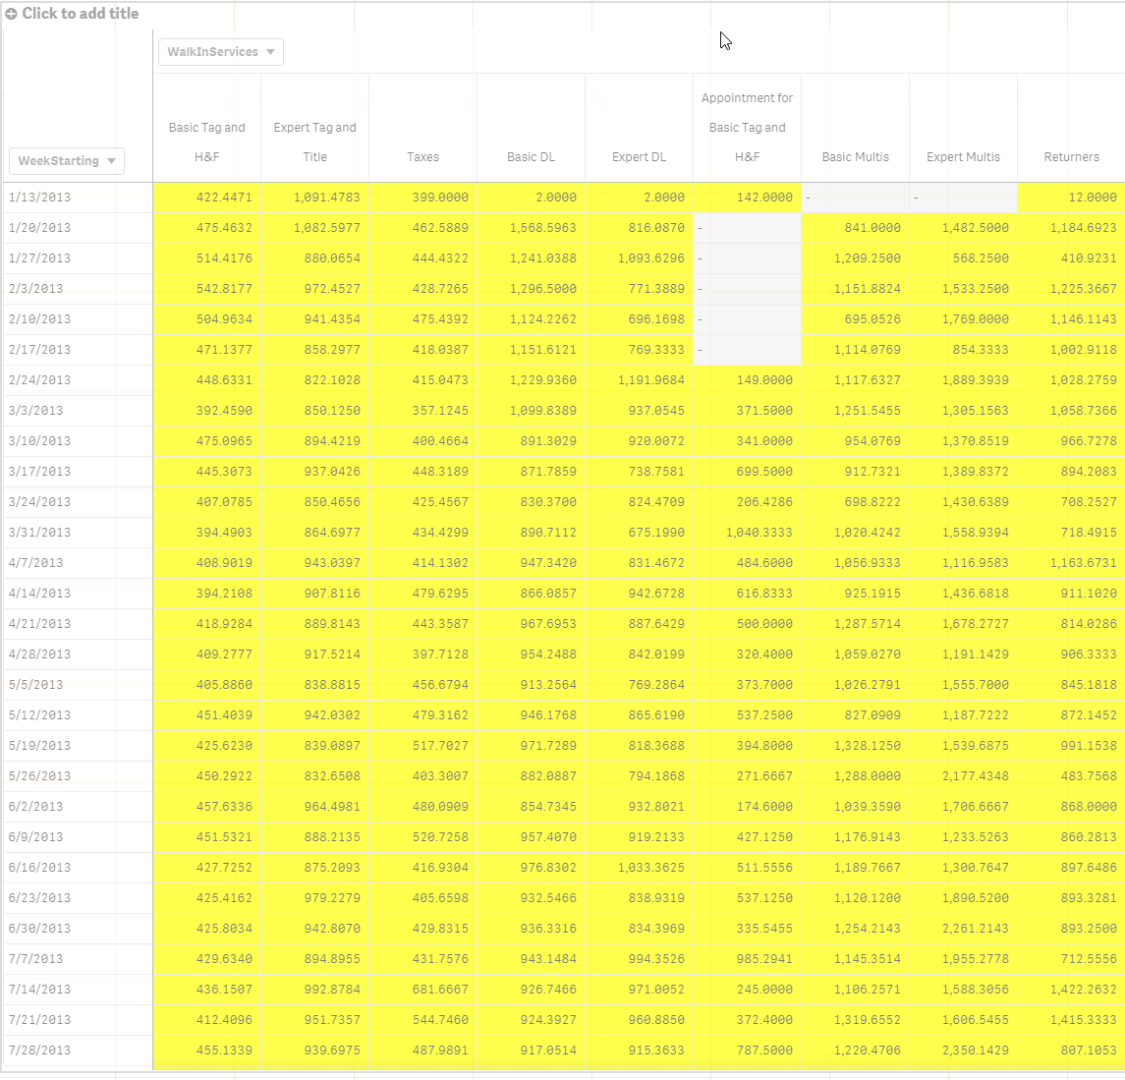
Basically, I've got a pivot table that looks like this:

Now, what I need to do is set conditional formatting on the column header. For example, for "Basic DL" my "Green" condition might be values less than 950, but on "Basic Titles" my "green" condition might be values less than 900. I've played around with the background color conditions and expressions (ColumnNo, Column, Lookup, etc), but I just cannot get the right combination of functions to get this right. Any thoughts or help would be greatly appreciated. Please note this is for Qlikview Sense Desktop.
- « Previous Replies
-
- 1
- 2
- Next Replies »
- Mark as New
- Bookmark
- Subscribe
- Mute
- Subscribe to RSS Feed
- Permalink
- Report Inappropriate Content
You can expand my previous post to a nested IF as such:
If([COLUMN NAME A] <=950, LightRed(),
If([COLUMN NAME A] >=950, Yellow())),
If([COLUMN NAME B] <=950, LightRed(),
If([COLUMN NAME B] >=950, Yellow())),
))))
Though, I suspect you have separate measures which simply refer to the same metric with altering calculations. If this is the case, you can refer to my previous post and simply specify the column name as above [Column Name A] rather than the metric.
Regards,
Michael
- Mark as New
- Bookmark
- Subscribe
- Mute
- Subscribe to RSS Feed
- Permalink
- Report Inappropriate Content
See the issue is that only evaluates the last result then applies it to the entire pivot table:
- Mark as New
- Bookmark
- Subscribe
- Mute
- Subscribe to RSS Feed
- Permalink
- Report Inappropriate Content
Can I see a sample QVF?
- Mark as New
- Bookmark
- Subscribe
- Mute
- Subscribe to RSS Feed
- Permalink
- Report Inappropriate Content
You need to use the formulas rather than the column names in order to get this functionality. I've taken a few screenshots of an application I've built which color codes specific cells in a column. First, I created some variables for my colors so if I want to change the color I only have to do it in one place and all of the colors update automatically.
I have a table like so:
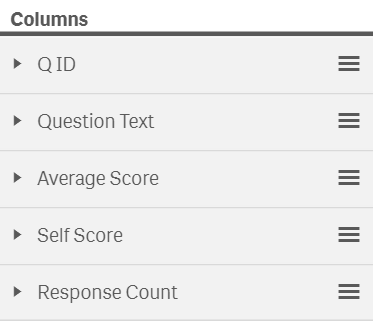
I want to color code the Average Score and Self Score columns:

The expression in the Average Score column is:
Avg(IF([Participant Group]<>'Self',[Answer Choice Value]))
The expression in the custom background color option is:
IF(Avg(IF([Participant Group]<>'Self',[Answer Choice Value]))=0,vYellow,
IF(Avg(IF([Participant Group]<>'Self',[Answer Choice Value]))>0,
IF(Avg(IF([Participant Group]<>'Self',[Answer Choice Value]))<=2,
IF(Avg(IF([Participant Group]<>'Self',[Answer Choice Value]))>1,vLightGreen,vGreenYellow),vScoreGreen),
IF(Avg(IF([Participant Group]<>'Self',[Answer Choice Value]))>=-2,
IF(Avg(IF([Participant Group]<>'Self',[Answer Choice Value]))<-1,vOrange,vOrangeYellow),vScoreRed)))
Which looks really obnoxious, but notice I'm using the same exact expression nested in some if statements to define the cutoff points for 7 distinct colors. An expression like this will need to be built for each column.
- « Previous Replies
-
- 1
- 2
- Next Replies »