Unlock a world of possibilities! Login now and discover the exclusive benefits awaiting you.
- Qlik Community
- :
- All Forums
- :
- QlikView App Dev
- :
- Re: how to select multiple fields when click only ...
- Subscribe to RSS Feed
- Mark Topic as New
- Mark Topic as Read
- Float this Topic for Current User
- Bookmark
- Subscribe
- Mute
- Printer Friendly Page
- Mark as New
- Bookmark
- Subscribe
- Mute
- Subscribe to RSS Feed
- Permalink
- Report Inappropriate Content
how to select multiple fields when click only one particular bar chart
Hello All
How to select two diff fields on clicking a bar chart,wat i mean is
let say if i got data like below
| Location | gove | sampling | dts | QUES |
| chanderia | 12 | 10 | 2/22/2016 | 20 |
| dr | 1 | 42 | 2/21/2016 | 30 |
| HP | 55 | 33 | 1/1/2016 | 40 |
| chanderia | 11 | 77 | 2/22/2015 | 40 |
| dr | 20 | 44 | 2/21/2015 | 50 |
| HP | 33 | 30 | 1/1/2015 | 60 |
so in one bar chart i am showing
Dimension:Location
Expression: firstsortvalue(gove,-dts)
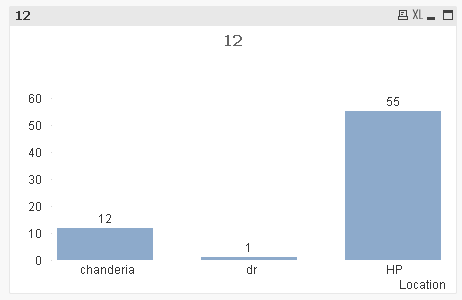
on selecting any bar i will get this:
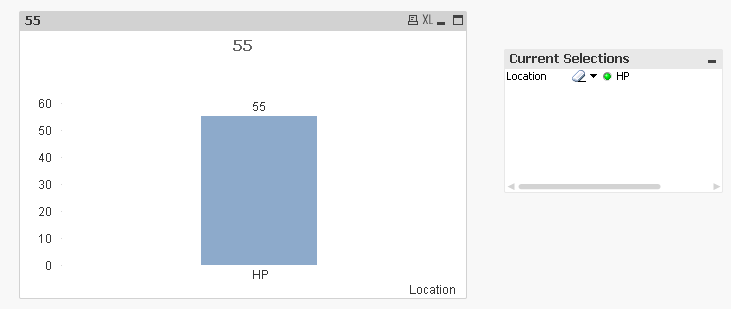
so what i am looking when i select only this bar chart i need the field gove should also getselected
what should i need to do achieve this task ...
thanks
naveen
- « Previous Replies
-
- 1
- 2
- Next Replies »
- Mark as New
- Bookmark
- Subscribe
- Mute
- Subscribe to RSS Feed
- Permalink
- Report Inappropriate Content
You can probably explore alternate state to do this for this specific chart.
- Mark as New
- Bookmark
- Subscribe
- Mute
- Subscribe to RSS Feed
- Permalink
- Report Inappropriate Content
finally i achieved what i am looking by applying cross table function...
one last help plz
i am trying to show a text box which should enabled only when
location=1 and quality='gove'
other then that it should be hidden
so in text box layout
i tried by write this
=getselectcount(location)=1 and how to write the other expression
- Mark as New
- Bookmark
- Subscribe
- Mute
- Subscribe to RSS Feed
- Permalink
- Report Inappropriate Content
This expression
=FirstSortedValue({<quality={gove}>},-dts)
is not right because your have not specified what are you finding the first sorted value of?
=FirstSortedValue({<quality={gove}>}FieldName,-dts)
- Mark as New
- Bookmark
- Subscribe
- Mute
- Subscribe to RSS Feed
- Permalink
- Report Inappropriate Content
yes ur correct,i sorted that
finally i achieved what i am looking by applying cross table function...
one last help plz
i am trying to show a text box which should enabled only when
location=1 and quality='gove'
other then that it should be hidden
so in text box layout
i tried by write this
=getselectcount(location)=1 and how to write the other expression
- Mark as New
- Bookmark
- Subscribe
- Mute
- Subscribe to RSS Feed
- Permalink
- Report Inappropriate Content
May be like this:
=GetSelectedCount(location)=1 and quality = 'gove'
- « Previous Replies
-
- 1
- 2
- Next Replies »