Unlock a world of possibilities! Login now and discover the exclusive benefits awaiting you.
- Qlik Community
- :
- Forums
- :
- Groups
- :
- Location and Language
- :
- Brasil
- :
- Re: expressoes de grafico tabela dinamica
- Subscribe to RSS Feed
- Mark Topic as New
- Mark Topic as Read
- Float this Topic for Current User
- Bookmark
- Subscribe
- Mute
- Printer Friendly Page
- Feature this Topic
- Mark as New
- Bookmark
- Subscribe
- Mute
- Subscribe to RSS Feed
- Permalink
- Report Inappropriate Content
expressoes de grafico tabela dinamica
Estou precisando efetuar cálculos comparativos entre dados de uma mesma dimensão em uma tabela dinâmica, mas não sei como fazê-lo. A tabela 1 do arquivo anexo contém os dados, já a tabela 2 a tabela dinâmica com os cálculos que preciso em amarelo.
Obrigado.
| Tabela 1 | ||
| produto | Local | Valor |
| arroz | MERCADO1 | 4 |
| feijao | MERCADO1 | 10 |
| massa | MERCADO1 | 4 |
| presunto | MERCADO1 | 20 |
| queijo | MERCADO1 | 25 |
| arroz | MERCADO2 | 3 |
| feijao | MERCADO2 | 7 |
| massa | MERCADO2 | 5 |
| presunto | MERCADO2 | 15 |
| queijo | MERCADO2 | 20 |
| arroz | MERCADO3 | 3,5 |
| feijao | MERCADO3 | 9 |
| massa | MERCADO3 | 4,5 |
| presunto | MERCADO3 | 22 |
| queijo | MERCADO3 | 25 |
| Tabela 2 | ||||||||
| Produto | MERCADO1 | MERCADO2 | MERCADO3 | Menor Valor | Maior Valor | Variação % | % M2/M1 | % M3/M1 |
| arroz | 4 | 3 | 3,5 | 3 | 4 | 133% | 75% | 88% |
| feijao | 10 | 7 | 9 | 7 | 10 | 143% | 70% | 90% |
| massa | 4 | 5 | 4,5 | 4 | 5 | 125% | 125% | 113% |
| presunto | 20 | 15 | 22 | 15 | 22 | 147% | 75% | 110% |
| queijo | 25 | 20 | 25 | 20 | 25 | 125% | 80% | 100% |
- Tags:
- Group_Discussions
Accepted Solutions
- Mark as New
- Bookmark
- Subscribe
- Mute
- Subscribe to RSS Feed
- Permalink
- Report Inappropriate Content
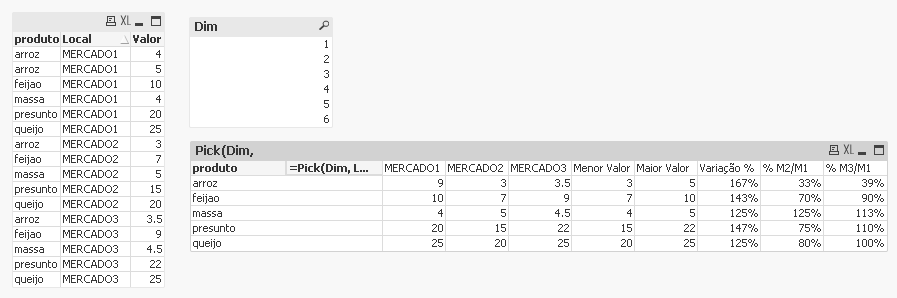
Change your expression to this:
Pick(Dim,
Sum(Valor),
Min(Valor),
Max(Valor),
Num(Max(Valor)/Min(Valor), '##.%'),
Num(Sum({<Local = {'MERCADO2'}>}Valor)/Sum({<Local = {'MERCADO1'}>}Valor), '##.%'),
Num(Sum({<Local = {'MERCADO3'}>}Valor)/Sum({<Local = {'MERCADO1'}>}Valor), '##.%'))
- Mark as New
- Bookmark
- Subscribe
- Mute
- Subscribe to RSS Feed
- Permalink
- Report Inappropriate Content
This:
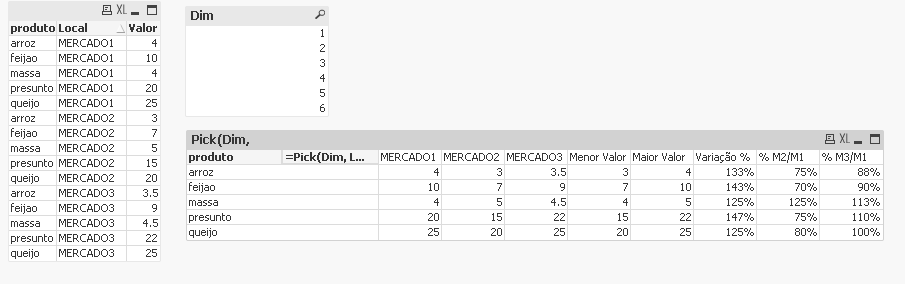
Script:
Table:
LOAD * INLINE [
produto, Local, Valor
arroz, MERCADO1, 4
feijao, MERCADO1, 10
massa, MERCADO1, 4
presunto, MERCADO1, 20
queijo, MERCADO1, 25
arroz, MERCADO2, 3
feijao, MERCADO2, 7
massa, MERCADO2, 5
presunto, MERCADO2, 15
queijo, MERCADO2, 20
arroz, MERCADO3, 3.5
feijao, MERCADO3, 9
massa, MERCADO3, 4.5
presunto, MERCADO3, 22
queijo, MERCADO3, 25
];
Dim:
LOAD * Inline [
Dim
1
2
3
4
5
6
];
Dimensions:
1) produto
2) =Pick(Dim,
Local,
'Menor Valor',
'Maior Valor',
'Variação %',
'% M2/M1',
'% M3/M1')
Expression:
Pick(Dim,
Sum(Valor),
Min(Valor),
Max(Valor),
Num(Max(Valor)/Min(Valor), '##.%'),
Num(Only({<Local = {'MERCADO2'}>}Valor)/Only({<Local = {'MERCADO1'}>}Valor), '##.%'),
Num(Only({<Local = {'MERCADO3'}>}Valor)/Only({<Local = {'MERCADO1'}>}Valor), '##.%'))
Sort order for 2nd dimension
Sort by Expression -> Dim
- Mark as New
- Bookmark
- Subscribe
- Mute
- Subscribe to RSS Feed
- Permalink
- Report Inappropriate Content
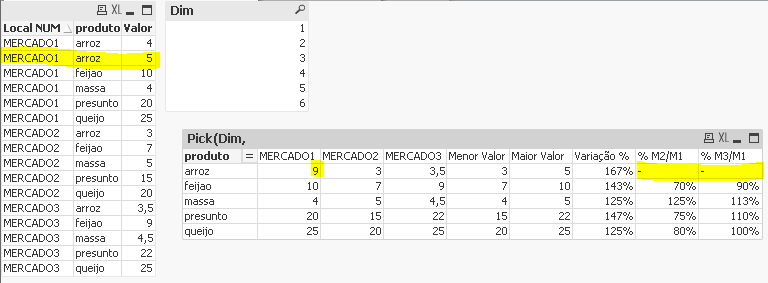
Thank you Sunny T!
But when I put some more data the formulas dont work...
- Mark as New
- Bookmark
- Subscribe
- Mute
- Subscribe to RSS Feed
- Permalink
- Report Inappropriate Content
Change your expression to this:
Pick(Dim,
Sum(Valor),
Min(Valor),
Max(Valor),
Num(Max(Valor)/Min(Valor), '##.%'),
Num(Sum({<Local = {'MERCADO2'}>}Valor)/Sum({<Local = {'MERCADO1'}>}Valor), '##.%'),
Num(Sum({<Local = {'MERCADO3'}>}Valor)/Sum({<Local = {'MERCADO1'}>}Valor), '##.%'))
- Mark as New
- Bookmark
- Subscribe
- Mute
- Subscribe to RSS Feed
- Permalink
- Report Inappropriate Content
Wow, This is beautifull!!! Thanks Sunny T!
taking advantage of your good will
There is a way to put the expressions between the columns of 'local'? Or a way to personalize the order of the columns regardless the type of data?
where I can learn about these things?
thank you!!!!!
Enviado do meu iPhone
Em 3 de jul de 2016, às 08:48, Sunny T <qcwebmaster@qlikview.com> escreveu:
expressoes de grafico tabela dinamica
reply from Sunny T in Qlik Brasil - View the full discussion
Change your expression to this:
Pick(Dim,
Sum(Valor),
Min(Valor),
Max(Valor),
Num(Max(Valor)/Min(Valor), '##.%'),
Num(Sum({<Local = {'MERCADO2'}>}Valor)/Sum({<Local = {'MERCADO1'}>}Valor), '##.%'),
Num(Sum({<Local = {'MERCADO3'}>}Valor)/Sum({<Local = {'MERCADO1'}>}Valor), '##.%'))
Reply to this message by replying to this email, or go to the message on Qlik Community
Start a new discussion in Qlik Brasil by email or at Qlik Community
Following expressoes de grafico tabela dinamica in these streams: Inbox
© 1993-2016 QlikTech International AB | Copyright & Trademarks | Privacy | Terms of Use | Software EULA
- Mark as New
- Bookmark
- Subscribe
- Mute
- Subscribe to RSS Feed
- Permalink
- Report Inappropriate Content
Columns of local? Do not understand this, can you elaborate?
With regards to the sort order, you can definitely customize the sort order using a sort order expression. There might be few ways to do this, what exact sort order are you looking for?
- Mark as New
- Bookmark
- Subscribe
- Mute
- Subscribe to RSS Feed
- Permalink
- Report Inappropriate Content
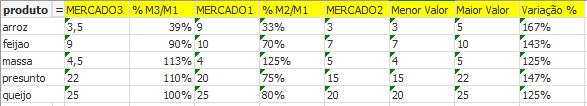
like this:
ps: this is just an example that I'm using to understande and apply into
more complex data
2016-07-03 12:02 GMT-03:00 Sunny T <qcwebmaster@qlikview.com>:
- Mark as New
- Bookmark
- Subscribe
- Mute
- Subscribe to RSS Feed
- Permalink
- Report Inappropriate Content
