Unlock a world of possibilities! Login now and discover the exclusive benefits awaiting you.
- Qlik Community
- :
- Forums
- :
- Analytics
- :
- App Development
- :
- Re: How to add trend chart into simple KPI ?
- Subscribe to RSS Feed
- Mark Topic as New
- Mark Topic as Read
- Float this Topic for Current User
- Bookmark
- Subscribe
- Mute
- Printer Friendly Page
- Mark as New
- Bookmark
- Subscribe
- Mute
- Subscribe to RSS Feed
- Permalink
- Report Inappropriate Content
How to add trend chart into simple KPI ?
Hi All
I saw the simple KPI demo , it able to add the chart into KPI template.
I try to add , but not sure where to add , can some one advise ?
Paul
- « Previous Replies
-
- 1
- 2
- Next Replies »
Accepted Solutions
- Mark as New
- Bookmark
- Subscribe
- Mute
- Subscribe to RSS Feed
- Permalink
- Report Inappropriate Content
hi Chanty
I Post the question to developer , his reply is below :-
You can add measure with some fake value (for example, using the following expression: ='Drag and Drop here'), then drag and drop master visualization into the value region or you can insert object id into the "Visualization" property for each measure.
but I still not sure
paul
- Mark as New
- Bookmark
- Subscribe
- Mute
- Subscribe to RSS Feed
- Permalink
- Report Inappropriate Content
my QVF
- Mark as New
- Bookmark
- Subscribe
- Mute
- Subscribe to RSS Feed
- Permalink
- Report Inappropriate Content
do u have QS server installed on ur machine?
- Mark as New
- Bookmark
- Subscribe
- Mute
- Subscribe to RSS Feed
- Permalink
- Report Inappropriate Content
Hi Chanty
No , i only use QS desktop trail version 2.2.4
Paul
- Mark as New
- Bookmark
- Subscribe
- Mute
- Subscribe to RSS Feed
- Permalink
- Report Inappropriate Content
den it will not work any more...
jst u want to chk for sample text extension
go to dev hub and there u will find the extension editor .. jst try to give some text and refrsh ur app it wil give that...
- Mark as New
- Bookmark
- Subscribe
- Mute
- Subscribe to RSS Feed
- Permalink
- Report Inappropriate Content
Hi Chanty
so in order to add chart into KPI template , i need to purchase QS server ?
But then how come the demo template created by Alex can display the chart ?
Paul
- Mark as New
- Bookmark
- Subscribe
- Mute
- Subscribe to RSS Feed
- Permalink
- Report Inappropriate Content
yes u need to. for that u need to write ur own JS and HTML and CSS code for that  i dnt hvn't tried.
chk below image and read that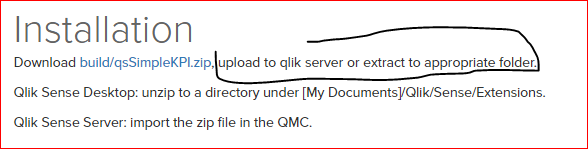
- Mark as New
- Bookmark
- Subscribe
- Mute
- Subscribe to RSS Feed
- Permalink
- Report Inappropriate Content
I though if I need to use browser to display chart then need to use special language . For simple KPI should not be so complicated .
Thank you any way
Sent from my iPhone
- Mark as New
- Bookmark
- Subscribe
- Mute
- Subscribe to RSS Feed
- Permalink
- Report Inappropriate Content
Hmmm no issues bro
- Mark as New
- Bookmark
- Subscribe
- Mute
- Subscribe to RSS Feed
- Permalink
- Report Inappropriate Content
hi Chanty
I Post the question to developer , his reply is below :-
You can add measure with some fake value (for example, using the following expression: ='Drag and Drop here'), then drag and drop master visualization into the value region or you can insert object id into the "Visualization" property for each measure.
but I still not sure
paul
- « Previous Replies
-
- 1
- 2
- Next Replies »