Unlock a world of possibilities! Login now and discover the exclusive benefits awaiting you.
- Qlik Community
- :
- Forums
- :
- Analytics
- :
- New to Qlik Analytics
- :
- Re: Load Inline
- Subscribe to RSS Feed
- Mark Topic as New
- Mark Topic as Read
- Float this Topic for Current User
- Bookmark
- Subscribe
- Mute
- Printer Friendly Page
- Mark as New
- Bookmark
- Subscribe
- Mute
- Subscribe to RSS Feed
- Permalink
- Report Inappropriate Content
Load Inline
Wondered whether someone could possibly help with a query? I have loaded some data into the script editor using the load inline method but only two of the metrics are appearing as an option for charts to link to. Does anyone know why this might be? The script is setup in the following way:
LOAD * INLINE [
Metric, YTD
Test 1, 89.8%
];
LOAD * INLINE [
Metric, YTD
Test 2, 95.5%
];
LOAD * INLINE [
Metric, YTD
Test 3, 96.2%
];
LOAD * INLINE [
Metric, YTD
Test 4, 85.5%
];
- Mark as New
- Bookmark
- Subscribe
- Mute
- Subscribe to RSS Feed
- Permalink
- Report Inappropriate Content
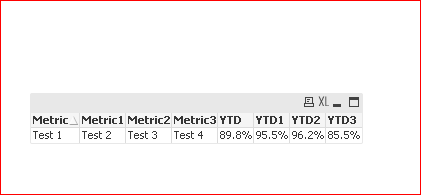
yes.. it will take as single table .. as field names are same [ Metric ,YTD]
so u can give other names to lik [ Metric1 -4 , YTD1-4]
and try
LOAD * INLINE [
Metric, YTD
Test 1, 89.8%
];
LOAD * INLINE [
Metric1, YTD1
Test 2, 95.5%
];
LOAD * INLINE [
Metric2, YTD2
Test 3, 96.2%
];
LOAD * INLINE [
Metric3, YTD3
Test 4, 85.5%
];
- Mark as New
- Bookmark
- Subscribe
- Mute
- Subscribe to RSS Feed
- Permalink
- Report Inappropriate Content
2 metric are appearing? Which 2?
- Mark as New
- Bookmark
- Subscribe
- Mute
- Subscribe to RSS Feed
- Permalink
- Report Inappropriate Content
I don't understand your problem, but you can simplify that script:
LOAD * INLINE [
Metric, YTD
Test 1, 89.8%
Test 2, 95.5%
Test 3, 96.2%
Test 4, 85.5%
];
I suggest that you post a sample document illustrating the problem.
- Mark as New
- Bookmark
- Subscribe
- Mute
- Subscribe to RSS Feed
- Permalink
- Report Inappropriate Content
see help:
Concatenating tables ‒ Qlik Sense
Automatic concatenation
If the field names and the number of fields of two or more loaded tables are exactly the same, Qlik Sense will automatically concatenate the content of the different statements into one table.
Regards