Unlock a world of possibilities! Login now and discover the exclusive benefits awaiting you.
- Qlik Community
- :
- Forums
- :
- Analytics
- :
- New to Qlik Analytics
- :
- Re: Pie chart and text values
- Subscribe to RSS Feed
- Mark Topic as New
- Mark Topic as Read
- Float this Topic for Current User
- Bookmark
- Subscribe
- Mute
- Printer Friendly Page
- Mark as New
- Bookmark
- Subscribe
- Mute
- Subscribe to RSS Feed
- Permalink
- Report Inappropriate Content
Pie chart and text values
Hello!
I have the following data consisting only of text fields:
| Customer | Product |
| CustomerA | Product1 |
| CustomerA | Product2 |
| CustomerA | Product1 |
| CustomerA | Product2 |
| CustomerA | Product3 |
| CustomerB | Product2 |
| CustomerB | Product2 |
| CustomerB | Product3 |
| CustomerB | Product2 |
| CustomerB | Product1 |
| CustomerC | Product3 |
| CustomerC | Product2 |
| CustomerC | Product2 |
| CustomerC | Product3 |
| CustomerC | Product2 |
I want to create a pie chart that shows the total percentage of the products (Product1 = 20%, Product2 = 53,33%, and Product3 = 26,67%). I would also like to include the Customer field as a filter so that the pie chart updates according to the selection I make.
I really hope that somebody can help me out here. Thank you! 
Accepted Solutions
- Mark as New
- Bookmark
- Subscribe
- Mute
- Subscribe to RSS Feed
- Permalink
- Report Inappropriate Content
Try a chart with dimension Product and expression
=Num( Count(Product) / Count(TOTAL Product) , '#.00%')
[or use Count(Product) with relative option and format using number tab]
The chart should be sensitive to filtering in Customer field by default.
- Mark as New
- Bookmark
- Subscribe
- Mute
- Subscribe to RSS Feed
- Permalink
- Report Inappropriate Content
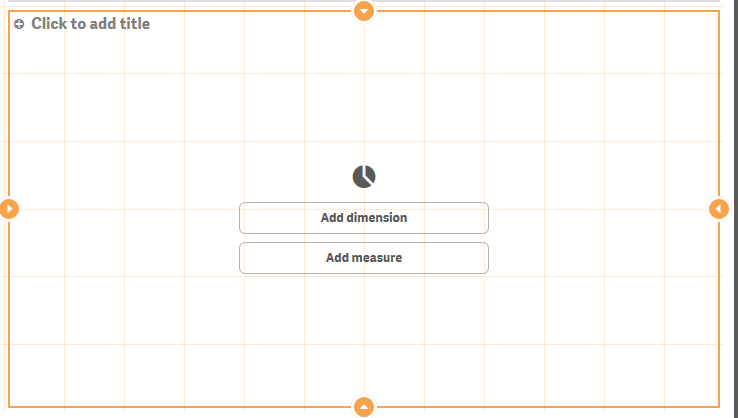
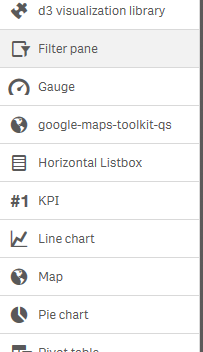
You should be able to create a pie chart with the expression count(Product). By dragging the pic chart icon onto the sheet, you can use the field Product as your dimension and the expression count(Product) as your measure.
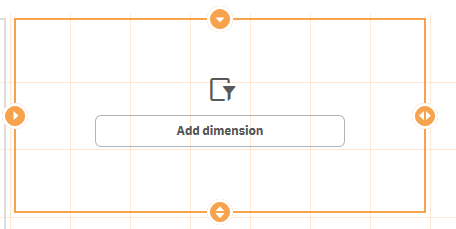
and create a filter pane with Customer. By dragging the filter pane icon onto the sheet and add Customer as the dimension
- Mark as New
- Bookmark
- Subscribe
- Mute
- Subscribe to RSS Feed
- Permalink
- Report Inappropriate Content
Thank you both! It worked!