Unlock a world of possibilities! Login now and discover the exclusive benefits awaiting you.
- Qlik Community
- :
- Forums
- :
- Analytics
- :
- New to Qlik Analytics
- :
- Re: Measure filter and graphs
- Subscribe to RSS Feed
- Mark Topic as New
- Mark Topic as Read
- Float this Topic for Current User
- Bookmark
- Subscribe
- Mute
- Printer Friendly Page
- Mark as New
- Bookmark
- Subscribe
- Mute
- Subscribe to RSS Feed
- Permalink
- Report Inappropriate Content
Measure filter and graphs
Hi all,
Last week I did a graph that calculated cost/income. I hade issues with having it still present all units when I selected a Branch. This was solved using this code:
Sum({<Unit, Region, Branch>}Cost)/Sum({<Unit, Region, Branch>}income)
Now I added a Measure filter so that I can switch between Cost/income and Income/Assets.
if( only(Measure)='C/I',
Sum({<Unit, Region, Branch>}Cost)/Sum({<Unit, Region, Branch>}income),
if( only(Measure)='Earnings',
Sum({<Unit, Region, Branch>}income)/Sum({<Unit, Region, Branch>}assets)
However, when I do this the graph no longer keeps all units when one is selected like it did without the measure filter.
Anyone knows how to fix my graph so that it keeps all units and can work with my measure filter?
Thanks!
Accepted Solutions
- Mark as New
- Bookmark
- Subscribe
- Mute
- Subscribe to RSS Feed
- Permalink
- Report Inappropriate Content
Try this:
If(Only({<Unit, Region, Branch>}Measure)='C/I',
Sum({<Unit, Region, Branch>}Cost)/Sum({<Unit, Region, Branch>}income),
If(Only({<Unit, Region, Branch>}Measure)='Earnings',
Sum({<Unit, Region, Branch>}income)/Sum({<Unit, Region, Branch>}assets)
- Mark as New
- Bookmark
- Subscribe
- Mute
- Subscribe to RSS Feed
- Permalink
- Report Inappropriate Content
Thanks so much! That solved it 
- Mark as New
- Bookmark
- Subscribe
- Mute
- Subscribe to RSS Feed
- Permalink
- Report Inappropriate Content
Hi again,
Your fix seems to work but I face another issue.
I added another ratio. Profitability:
If(Only({<Unit, Region, Branch>}Measure)='Profitability',
(Sum({<Unit, Region, Branch>}income)-Sum({<Unit, Region, Branch>}cost)) * 0.77/Sum({<Unit, Region, Branch>}assets)
Now when I do different filterings units, regions and branches sometimes disappears and only the selected one is shown. Especially when I filter customers on for example Gender. So in the graph that should present one of the ratios for each of the 4 Units now only presents the selected one.
Is there a good explaination to why this happens?
Thanks!
- Mark as New
- Bookmark
- Subscribe
- Mute
- Subscribe to RSS Feed
- Permalink
- Report Inappropriate Content
I am not entirely sure I understand what is happening. Would you be able to elaborate or provide a sample to show the issue?
- Mark as New
- Bookmark
- Subscribe
- Mute
- Subscribe to RSS Feed
- Permalink
- Report Inappropriate Content
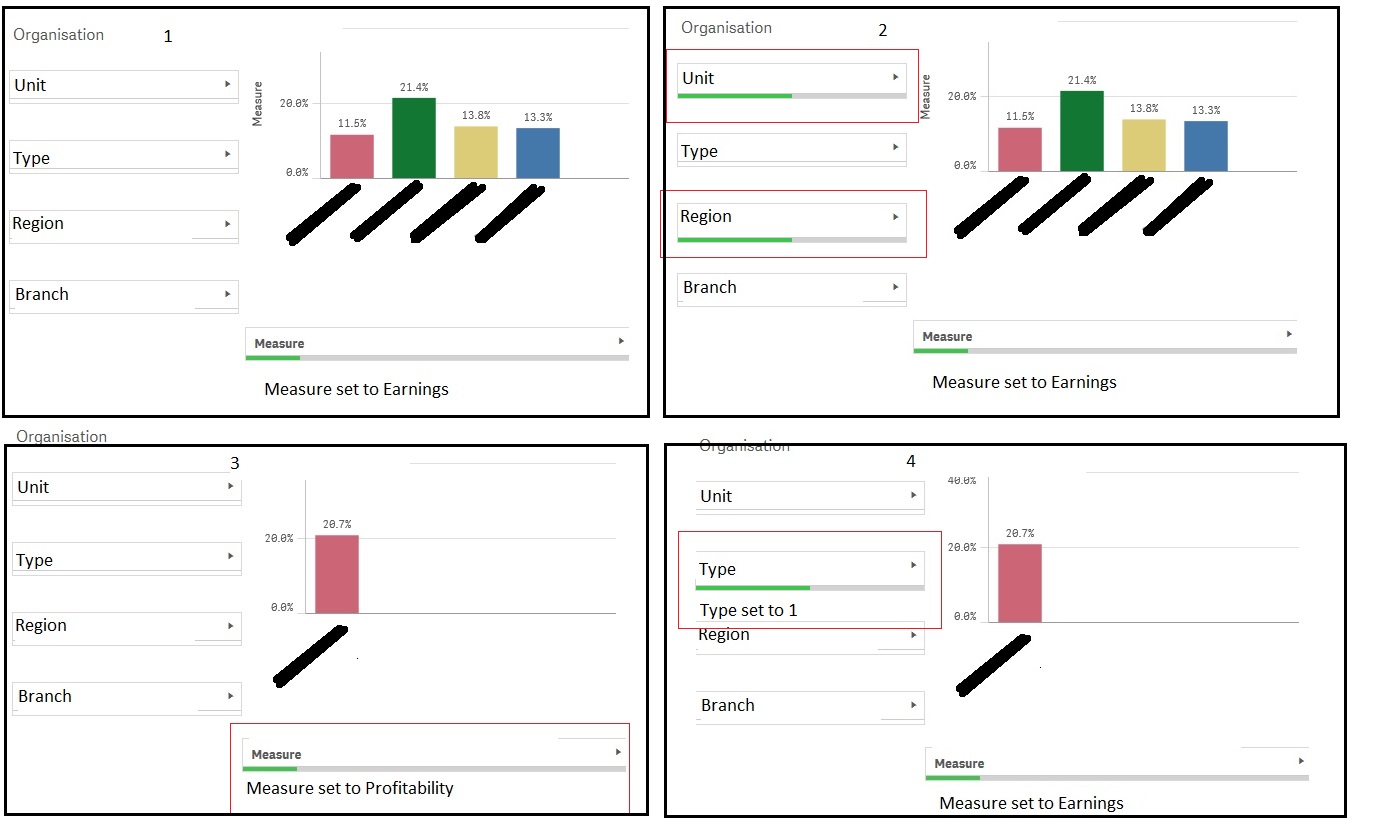
So I have 5 filters (4 dimensions and 1 measure). I have 3 graphs but let's stick to one of them. That graph should show all 4 possible units at all times but change ratio dependent on the measure filter and the value dependent on the 4th dimension Type. I use this code:
If(Only({<Unit, Region, Branch>}Measure)='C/I',
Sum({<Unit, Region, Branch>}Cost)/Sum({<Unit, Region, Branch>}income),
If(Only({<Unit, Region, Branch>}Measure)='Earnings',
Sum({<Unit, Region, Branch>}income)/Sum({<Unit, Region, Branch>}assets),
If(Only({<Unit, Region, Branch>}Measure)='Profitability',
(Sum({<Unit, Region, Branch>}income)-Sum({<Unit, Region, Branch>}cost)) * 0.77/Sum({<Unit, Region, Branch>}assets)
It is a simple bar chart. It looks ok to start but then only 1 of the 4 units are shown when I filter. Furthermore, it could be that for one of the measures it works but not for the others. To make it even more weird, it seems like it sometimes work and sometimes not without me even changing anything. The picture below shows 4 scenarios. Stuff stops working for one of the measurements (pic 3) as well as if I start filtering by type (pic 4).