Unlock a world of possibilities! Login now and discover the exclusive benefits awaiting you.
- Qlik Community
- :
- All Forums
- :
- QlikView App Dev
- :
- Re: How to reduce the number of values displayed o...
- Subscribe to RSS Feed
- Mark Topic as New
- Mark Topic as Read
- Float this Topic for Current User
- Bookmark
- Subscribe
- Mute
- Printer Friendly Page
- Mark as New
- Bookmark
- Subscribe
- Mute
- Subscribe to RSS Feed
- Permalink
- Report Inappropriate Content
How to reduce the number of values displayed on x-axis of a chart?
Hi,
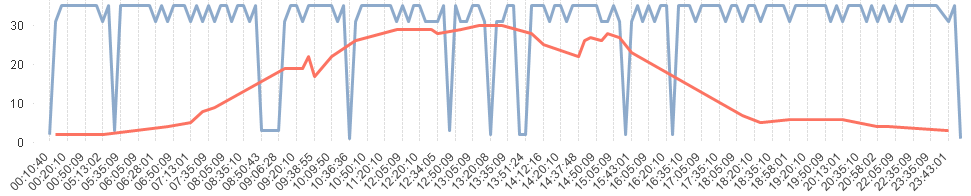
I have a line chart which uses "time" as dimension which has the value in the intervals of 15 mins (Format is hh:mm:ss). X - axis of this graph displays all the values in the "time" field which looks very clumsy in the graph. So how can i reduce this frequency of values on x - axis to display just very 4th value without changing the graph? I mean i just want to hide few values on the x - axis.
Thank you.
Accepted Solutions
- Mark as New
- Bookmark
- Subscribe
- Mute
- Subscribe to RSS Feed
- Permalink
- Report Inappropriate Content
Hi Apoorva!
Try this: in Chart Properties dialog, in Axes Tab, set the Primary (and Secondary) Labels to horizontal mode ("-" option). This will heap the time values displayed. Then uncheck the "Stagger Labels" option.
Hope it helps!
Marcello
- Mark as New
- Bookmark
- Subscribe
- Mute
- Subscribe to RSS Feed
- Permalink
- Report Inappropriate Content
Can you share a sample app or a screen shot of what your output should be ?
- Mark as New
- Bookmark
- Subscribe
- Mute
- Subscribe to RSS Feed
- Permalink
- Report Inappropriate Content
- Mark as New
- Bookmark
- Subscribe
- Mute
- Subscribe to RSS Feed
- Permalink
- Report Inappropriate Content
My graph looks like the one in the attached image. What i would like to achieve is, i what my graph to look the same, but the frequency of "time" values displayed on x-axis should be reduced.
- Mark as New
- Bookmark
- Subscribe
- Mute
- Subscribe to RSS Feed
- Permalink
- Report Inappropriate Content
Hi Apoorva!
Try this: in Chart Properties dialog, in Axes Tab, set the Primary (and Secondary) Labels to horizontal mode ("-" option). This will heap the time values displayed. Then uncheck the "Stagger Labels" option.
Hope it helps!
Marcello
- Mark as New
- Bookmark
- Subscribe
- Mute
- Subscribe to RSS Feed
- Permalink
- Report Inappropriate Content
Hi Apoorva,
go to settings of your charts: tab>presentation tab and make the following selections (see attached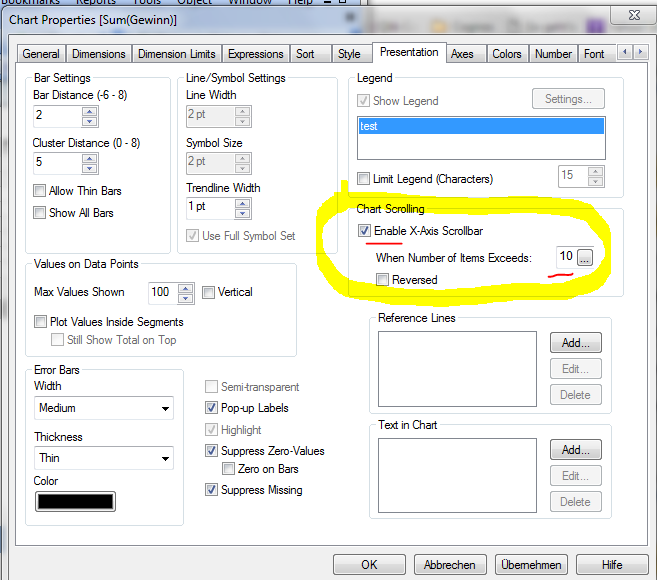 )
)
hope that helps
beck
- Mark as New
- Bookmark
- Subscribe
- Mute
- Subscribe to RSS Feed
- Permalink
- Report Inappropriate Content
Hi Apoorva,
try Dimension
=Time(Floor(TimeField,6))
Regards,
Antonio
- Mark as New
- Bookmark
- Subscribe
- Mute
- Subscribe to RSS Feed
- Permalink
- Report Inappropriate Content
Hi Marcello,
Thanks for the reply, it worked 
- Mark as New
- Bookmark
- Subscribe
- Mute
- Subscribe to RSS Feed
- Permalink
- Report Inappropriate Content
Hi Beck,
Thank you for the suggestion. But I din't wanted to use a scroll bar!
- Mark as New
- Bookmark
- Subscribe
- Mute
- Subscribe to RSS Feed
- Permalink
- Report Inappropriate Content
Hi Antonio,
Thanks for the reply. I tried this solution, but it gives me the graph only for time, 12:00:00 AM.