Unlock a world of possibilities! Login now and discover the exclusive benefits awaiting you.
- Qlik Community
- :
- All Forums
- :
- QlikView App Dev
- :
- Re: Graph seems to be locked to 1 value
- Subscribe to RSS Feed
- Mark Topic as New
- Mark Topic as Read
- Float this Topic for Current User
- Bookmark
- Subscribe
- Mute
- Printer Friendly Page
- Mark as New
- Bookmark
- Subscribe
- Mute
- Subscribe to RSS Feed
- Permalink
- Report Inappropriate Content
Graph seems to be locked to 1 value
Dear all,
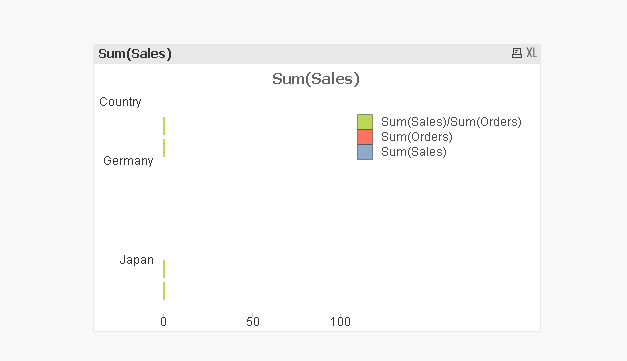
I am working with the attached QlikView file. What I try to accomplish i creating a dynamic analysis tool. The graph should show the sum of sales, orders and sum of sales / sum of orders depending on the parameters you select.
When I select something it however only values going up to 1... Any thoughts on what goes wrong with my script?
Accepted Solutions
- Mark as New
- Bookmark
- Subscribe
- Mute
- Subscribe to RSS Feed
- Permalink
- Report Inappropriate Content
Hi Marc,
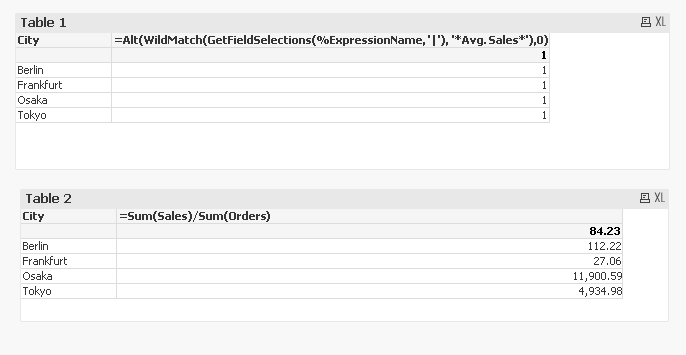
Here's what the figures look like on a straight table object using the expressions
1. =Alt(WildMatch(GetFieldSelections(%ExpressionName, '|'), '*Avg. Sales*'),0)
2. =Sum(Sales)/Sum(Orders)
- Mark as New
- Bookmark
- Subscribe
- Mute
- Subscribe to RSS Feed
- Permalink
- Report Inappropriate Content
Hi Marc,
Are you trying to achieve what Lee Mathews demoed here :
QlikView How To (or Tips & Tricks) Application
Regards,
Jonathan Penuliar
- Mark as New
- Bookmark
- Subscribe
- Mute
- Subscribe to RSS Feed
- Permalink
- Report Inappropriate Content
Jes but as this is way more advanced that what I tried to do a simple answer to my question would be better for my understanding.
- Mark as New
- Bookmark
- Subscribe
- Mute
- Subscribe to RSS Feed
- Permalink
- Report Inappropriate Content
have a look at attached file.
Regards,
JP
- Mark as New
- Bookmark
- Subscribe
- Mute
- Subscribe to RSS Feed
- Permalink
- Report Inappropriate Content
I still have the same issue this is what I get...
- Mark as New
- Bookmark
- Subscribe
- Mute
- Subscribe to RSS Feed
- Permalink
- Report Inappropriate Content
I noticed from your attachment that your expression does not return summed values, it returns 1 or 0.
if you wanted to return total sales your expression should be Sum(Sales)
- Mark as New
- Bookmark
- Subscribe
- Mute
- Subscribe to RSS Feed
- Permalink
- Report Inappropriate Content
Hi Jonathan,
I do not completely understand what you mean... Could you elaborate with an example?
- Mark as New
- Bookmark
- Subscribe
- Mute
- Subscribe to RSS Feed
- Permalink
- Report Inappropriate Content
Hi Marc,
Here's what the figures look like on a straight table object using the expressions
1. =Alt(WildMatch(GetFieldSelections(%ExpressionName, '|'), '*Avg. Sales*'),0)
2. =Sum(Sales)/Sum(Orders)