Unlock a world of possibilities! Login now and discover the exclusive benefits awaiting you.
- Qlik Community
- :
- All Forums
- :
- QlikView App Dev
- :
- Re: Pie chart
Options
- Subscribe to RSS Feed
- Mark Topic as New
- Mark Topic as Read
- Float this Topic for Current User
- Bookmark
- Subscribe
- Mute
- Printer Friendly Page
Turn on suggestions
Auto-suggest helps you quickly narrow down your search results by suggesting possible matches as you type.
Showing results for
Not applicable
2016-07-28
12:58 AM
- Mark as New
- Bookmark
- Subscribe
- Mute
- Subscribe to RSS Feed
- Permalink
- Report Inappropriate Content
Pie chart
Hi Everyone,
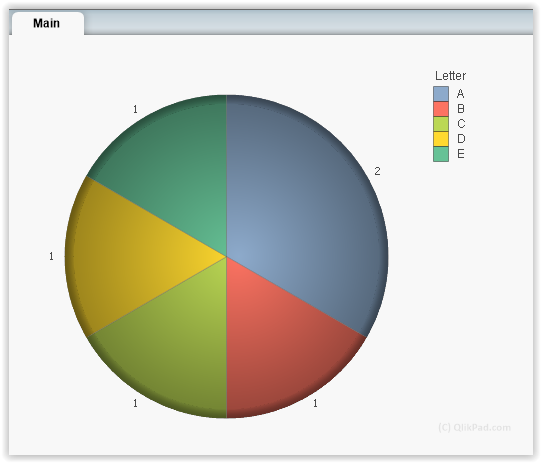
How would I go about creating a pie chart out of the following data:
| Field 1 | Field 2 |
|---|---|
| A | B |
| C | A |
| D | E |
The end result I would like to achieve is a pie chart with 1/3 showing "A", 1/6" showing B, C, D, E.
Thanks!
284 Views
3 Replies
Not applicable
2016-07-31
12:30 PM
Author
- Mark as New
- Bookmark
- Subscribe
- Mute
- Subscribe to RSS Feed
- Permalink
- Report Inappropriate Content
Hello Britney,
I've taken your table as initial source, but I had to remodel it to get outcome you expect:
Try attached app.
BR,
Kuba
152 Views
MVP
2016-07-31
02:46 PM
- Mark as New
- Bookmark
- Subscribe
- Mute
- Subscribe to RSS Feed
- Permalink
- Report Inappropriate Content
use a crosstable load to get one field you can use as dimension
hope this helps
regards
Marco
MVP
2016-08-01
02:38 AM
- Mark as New
- Bookmark
- Subscribe
- Mute
- Subscribe to RSS Feed
- Permalink
- Report Inappropriate Content
You could use the Crosstable or you could concat both the fields into one
152 Views