Unlock a world of possibilities! Login now and discover the exclusive benefits awaiting you.
- Qlik Community
- :
- Forums
- :
- Analytics
- :
- App Development
- :
- Re: Aggr Line Chart help
- Subscribe to RSS Feed
- Mark Topic as New
- Mark Topic as Read
- Float this Topic for Current User
- Bookmark
- Subscribe
- Mute
- Printer Friendly Page
- Mark as New
- Bookmark
- Subscribe
- Mute
- Subscribe to RSS Feed
- Permalink
- Report Inappropriate Content
Aggr Line Chart help
Please help!
I am creating a cumulative line chart and I am having some issues,
The data is retrived from a QVD, and the date in the QVD starts from 9,15,2015
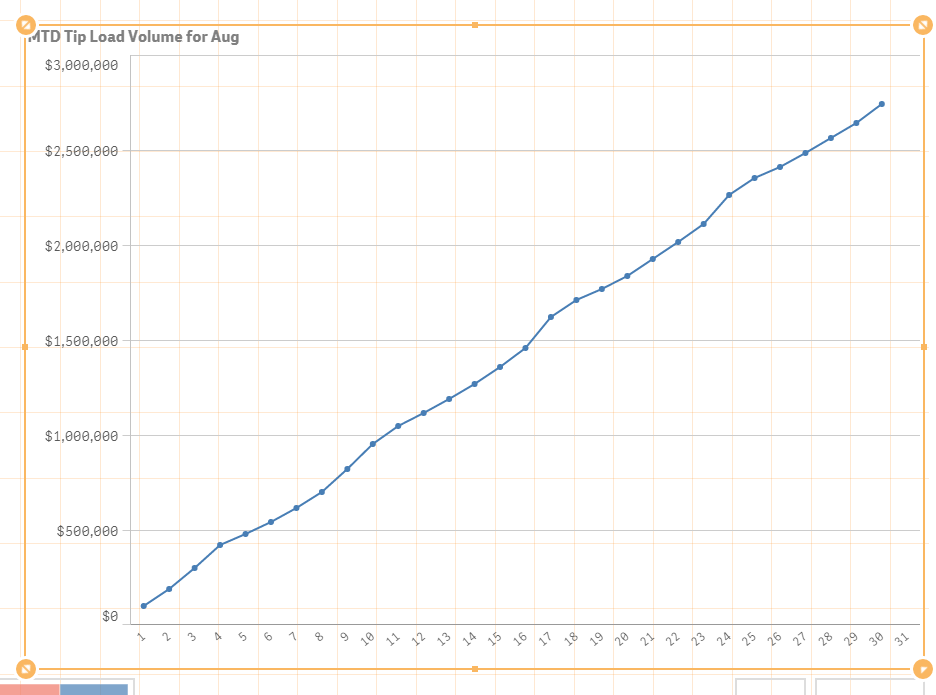
The line chart is for current month, that's why there is only one line. I dont know why the line moves down on the 15th for current month.
Here is the chart:
Dimensions: Day - Year
Expression - aggr(Rangesum(above(TOTAL(SUM ({<Month = {$(=Month(Today()))} , MonthYear=, WeekDay=>} [TIPS Amount])), 0,rowno(TOTAL))), Year, Month, Day)

Please explain why the chart dips on the 15th.
Thanks!
Accepted Solutions
- Mark as New
- Bookmark
- Subscribe
- Mute
- Subscribe to RSS Feed
- Permalink
- Report Inappropriate Content
- Mark as New
- Bookmark
- Subscribe
- Mute
- Subscribe to RSS Feed
- Permalink
- Report Inappropriate Content
Hi,
Its not possible to understand this issue, unless you share the sample data with us.
If possible share the sample .qvf file which will show your problem.
Regards,
Kaushik Solanki
- Mark as New
- Bookmark
- Subscribe
- Mute
- Subscribe to RSS Feed
- Permalink
- Report Inappropriate Content
How about trying this:
Aggr(RangeSum(Above(TOTAL(SUM ({<Month = {$(=Month(Today()))} , MonthYear=, WeekDay=>} [TIPS Amount])), 0, RowNo(TOTAL))), (Year, (NUMERIC)), (Month, (NUMERIC)), (Day, (NUMERIC)))
- Mark as New
- Bookmark
- Subscribe
- Mute
- Subscribe to RSS Feed
- Permalink
- Report Inappropriate Content
Hi Kaushik, Here is the file. please let me know if can provide any clarity to it. THANKS!
- Mark as New
- Bookmark
- Subscribe
- Mute
- Subscribe to RSS Feed
- Permalink
- Report Inappropriate Content
Hi Sunil, could you else what the numeric value will be?
I am attaching a file to this.
THANKS!
- Mark as New
- Bookmark
- Subscribe
- Mute
- Subscribe to RSS Feed
- Permalink
- Report Inappropriate Content
Attaching the QVF and the QVD generator code to the original post.
- Mark as New
- Bookmark
- Subscribe
- Mute
- Subscribe to RSS Feed
- Permalink
- Report Inappropriate Content
- Mark as New
- Bookmark
- Subscribe
- Mute
- Subscribe to RSS Feed
- Permalink
- Report Inappropriate Content
YES!
Thank you so much! This really helps!