Unlock a world of possibilities! Login now and discover the exclusive benefits awaiting you.
- Qlik Community
- :
- All Forums
- :
- QlikView App Dev
- :
- Re: Dynamic Chart selection with drill down capabi...
- Subscribe to RSS Feed
- Mark Topic as New
- Mark Topic as Read
- Float this Topic for Current User
- Bookmark
- Subscribe
- Mute
- Printer Friendly Page
- Mark as New
- Bookmark
- Subscribe
- Mute
- Subscribe to RSS Feed
- Permalink
- Report Inappropriate Content
Dynamic Chart selection with drill down capability
I currently have a chart that shows number of transaction per month for a year. You can click into a month to see the number of transactions for that particular month only. What I would like to do is add a further drill down option to see each date for a chosen month's transactions. I'd like a button that is only visible when a month is currently chosen that when selected it displays the transactions by date. How can I dynamically display the button and the chart with dates?
Accepted Solutions
- Mark as New
- Bookmark
- Subscribe
- Mute
- Subscribe to RSS Feed
- Permalink
- Report Inappropriate Content
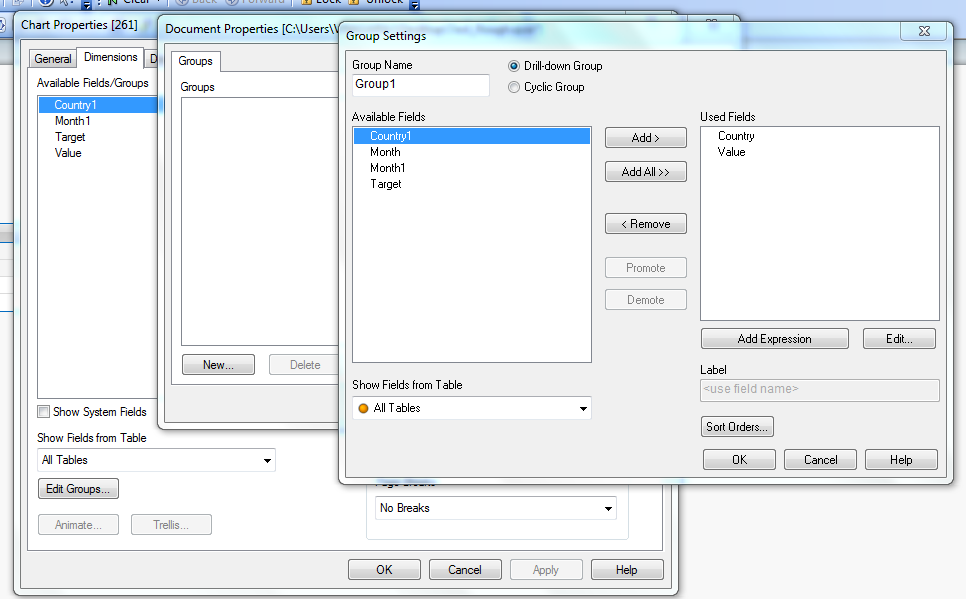
On your dimension tab you will see the following:
Next you choose new group:
In your group creation the first field will be your Month the Second field will be your Date. Make sure to use the drill down option and not cycle.
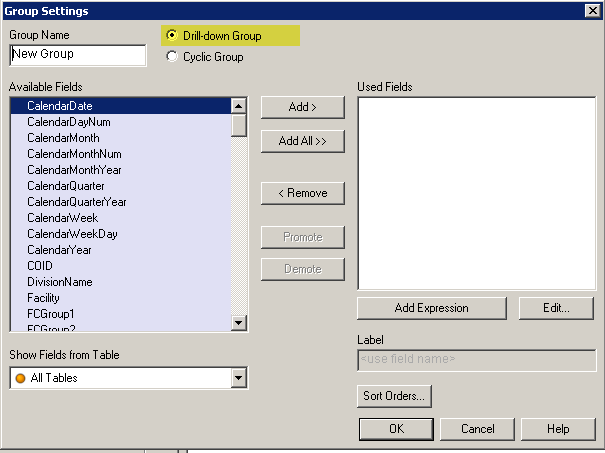
Once you create the drill down group add it to your chart object as a dimension
- Mark as New
- Bookmark
- Subscribe
- Mute
- Subscribe to RSS Feed
- Permalink
- Report Inappropriate Content
On the Layout tab of the button, you can put GetSelectedCount(Month) = 1 in the Conditional window so it will only appear if you have 1 month selected.
- Mark as New
- Bookmark
- Subscribe
- Mute
- Subscribe to RSS Feed
- Permalink
- Report Inappropriate Content
What is the best way to create the button?
- Mark as New
- Bookmark
- Subscribe
- Mute
- Subscribe to RSS Feed
- Permalink
- Report Inappropriate Content
Why dont you use drill down functionality (Group) in Qlikview, will that suffice your requirement.
Create a Drill down group with Year, Month,Date. Provided you have date fields with valid dates.
What is the button used for, here?
Thanks,
V.
- Mark as New
- Bookmark
- Subscribe
- Mute
- Subscribe to RSS Feed
- Permalink
- Report Inappropriate Content
How do I create a Group? I do have a date field with valid dates.
- Mark as New
- Bookmark
- Subscribe
- Mute
- Subscribe to RSS Feed
- Permalink
- Report Inappropriate Content
Either conditionally display the Date column
condition
GetSelectedcount(Month)=1
or as vishsaggi said use drill down.
I would suggest drill down.
As your question goes for the button create a Variable and a button to trigger that variable.
Conditionally display your date column if the value of the variable is 1.
Thanks
- Mark as New
- Bookmark
- Subscribe
- Mute
- Subscribe to RSS Feed
- Permalink
- Report Inappropriate Content
On your dimension tab you will see the following:
Next you choose new group:
In your group creation the first field will be your Month the Second field will be your Date. Make sure to use the drill down option and not cycle.
Once you create the drill down group add it to your chart object as a dimension
- Mark as New
- Bookmark
- Subscribe
- Mute
- Subscribe to RSS Feed
- Permalink
- Report Inappropriate Content
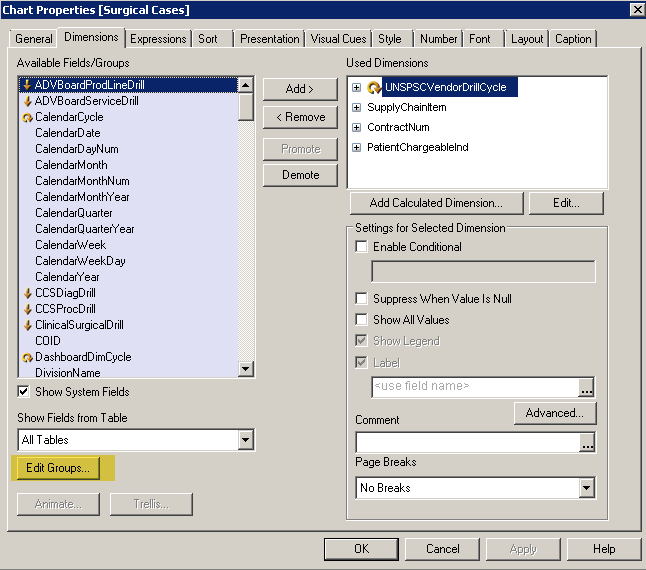
In the chart (Any chart) properties -> Dimensions Tab -> follow this screenshot.
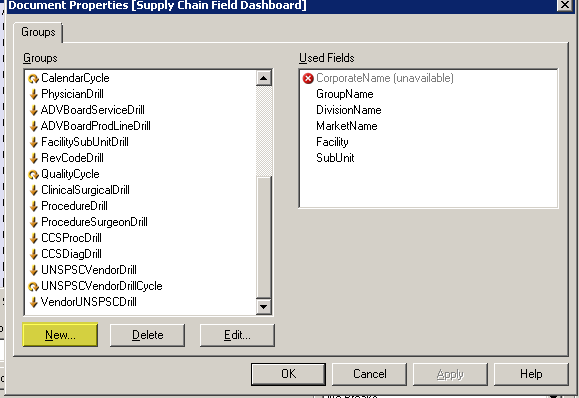
Another way You can also create groups using Doc Properties -> Group Tab.