Unlock a world of possibilities! Login now and discover the exclusive benefits awaiting you.
- Qlik Community
- :
- Forums
- :
- Analytics
- :
- New to Qlik Analytics
- :
- Re: Showing negative values in Year over year by m...
- Subscribe to RSS Feed
- Mark Topic as New
- Mark Topic as Read
- Float this Topic for Current User
- Bookmark
- Subscribe
- Mute
- Printer Friendly Page
- Mark as New
- Bookmark
- Subscribe
- Mute
- Subscribe to RSS Feed
- Permalink
- Report Inappropriate Content
Showing negative values in Year over year by month
Hi all,
I want to show a line graph where it displays Year over year by month of count of invitations.
I want to show graph for previous and current year.
I have tried with
Dimension : year and Month
Expression :
count({<DateType = {invitation},Year = {$(=max(Year))}>}invitation_id)-count({<DateType = {invitation},Year ={$(=max(Year)-1)}>}invitation_id)
I think there is wrong in my expression.So it is showing negative values I have attached qvf file .
Please help me in this regard.Any kind of help is appreciated.
Regards.
- Tags:
- year over year
- yoy
- Mark as New
- Bookmark
- Subscribe
- Mute
- Subscribe to RSS Feed
- Permalink
- Report Inappropriate Content
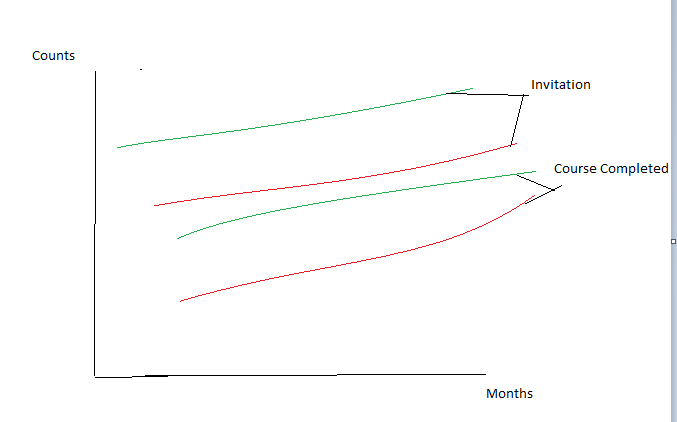
Like in below image i need to show graph. For both current(Green) and previous year(red) of invitations and Course Completed YOY Counts.
- Mark as New
- Bookmark
- Subscribe
- Mute
- Subscribe to RSS Feed
- Permalink
- Report Inappropriate Content
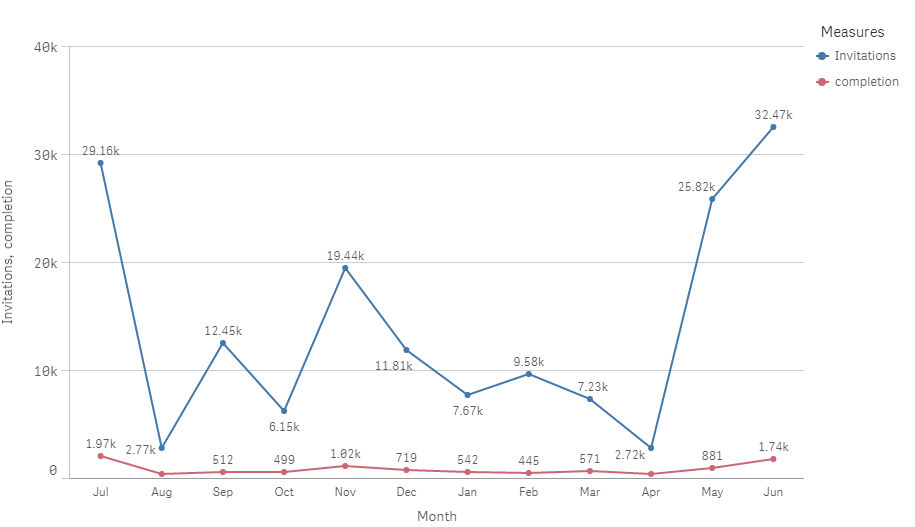
this?
- Mark as New
- Bookmark
- Subscribe
- Mute
- Subscribe to RSS Feed
- Permalink
- Report Inappropriate Content
Yes.
But it has to show for both current and previous year.
- Mark as New
- Bookmark
- Subscribe
- Mute
- Subscribe to RSS Feed
- Permalink
- Report Inappropriate Content
add two expression for current and previous year
cuu yr:
count({<DateType = {Completed},
Canon_Year = {"$(=year(max(CanonicalDate)))"}>}course_completed)
pre Yr:
count({<DateType = {Completed},
Canon_Year = {"$(=year(max(CanonicalDate))-1)"}>}course_completed)
- Mark as New
- Bookmark
- Subscribe
- Mute
- Subscribe to RSS Feed
- Permalink
- Report Inappropriate Content
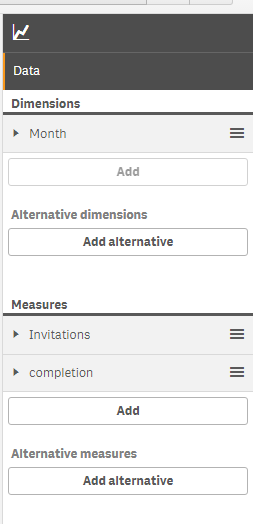
I am not able to add one more expression, ADD button of Measures is not Highlighted.Thats the problem i am facing.
- Mark as New
- Bookmark
- Subscribe
- Mute
- Subscribe to RSS Feed
- Permalink
- Report Inappropriate Content
in line chart u can add measures as u want. check properly under expression
- Mark as New
- Bookmark
- Subscribe
- Mute
- Subscribe to RSS Feed
- Permalink
- Report Inappropriate Content
Check by adding two Dimension.
You wont be able to add Expression more than one
- Mark as New
- Bookmark
- Subscribe
- Mute
- Subscribe to RSS Feed
- Permalink
- Report Inappropriate Content
try the option add alternative measure
- Mark as New
- Bookmark
- Subscribe
- Mute
- Subscribe to RSS Feed
- Permalink
- Report Inappropriate Content
Nothing get displayed if i add in Alternate measure, in line graph
- Mark as New
- Bookmark
- Subscribe
- Mute
- Subscribe to RSS Feed
- Permalink
- Report Inappropriate Content
Hi,
I need to Show counts YOY of completions and Invitation in Line Graph.
I have dimension : Year and Month
Expression:
fabs(count({<DateType = {invitation},
Year = {$(=max(Year))}>}invitation_id)-count({<DateType = {invitation},
Year = {$(=max(Year)-1)}>}invitation_id)
)
Here i need to add one more expression, but i am not able to add onemore expression.
Can we add more than one expression while calculating YOY by month??