Unlock a world of possibilities! Login now and discover the exclusive benefits awaiting you.
- Qlik Community
- :
- All Forums
- :
- QlikView App Dev
- :
- Re: Qlikview Combochart color gradient
- Subscribe to RSS Feed
- Mark Topic as New
- Mark Topic as Read
- Float this Topic for Current User
- Bookmark
- Subscribe
- Mute
- Printer Friendly Page
- Mark as New
- Bookmark
- Subscribe
- Mute
- Subscribe to RSS Feed
- Permalink
- Report Inappropriate Content
Qlikview Combochart color gradient
Hi,
i have combo chart with 2 expression
1) Avg(Revenue)
2) Count(id)
i want to the first expression to present in the bar and the color of the bar's should be like
If the value is < 0 then Blue and if the value >0 then green. But the color's should be in gradient based on the count(id) (expression 2)
if the value of 2nd expression is low the bar color should be light and if the value is high the color should be darker.
Can some one please advise.
Accepted Solutions
- Mark as New
- Bookmark
- Subscribe
- Mute
- Subscribe to RSS Feed
- Permalink
- Report Inappropriate Content
Hi,
It's difficult to sort this for you at a distance so to speak but consider this. The expression I've suggested has this ratio at its heart:
(Count(id)- min(TOTAL Aggr(Count(id),Dimension)))
/
( max(TOTAL Aggr(Count(id),Dimension)) - min(TOTAL Aggr(Count(id),Dimension)))
When the Count(id) take its minimum value the top line will equal zero, the bottom line will not be zero so the ratio as a whole will equal zero. When Count(id) takes its maximum value the top line and the bottom line will be equal and non zero so the ratio will equal 1.
If you have two charts with a different count of id the ratio should still range between 0 and 1 if the Aggr expressions are doing their jobs. In two charts that are giving different shades for their max value of count(id) test the Aggr expressions by adding these expressions:
min(TOTAL Aggr(Count(id),Dimension))
and
max(TOTAL Aggr(Count(id),Dimension))
In fact I would copy your charts and change the copies to a straight table to see better what's going on. For the chart with maximum count of id as 50 you should find that max(TOTAL Aggr(Count(id),Dimension)) will return 50 across all the values of the dimension and return 20 for the other chart.
Please let me know how you get on.
Good luck
Andrew
- Mark as New
- Bookmark
- Subscribe
- Mute
- Subscribe to RSS Feed
- Permalink
- Report Inappropriate Content
Hi,
I would use the ARGB function.
try setting the background colour to this but replace 'Dimension' with the dimension of your chart:
ARGB(
55 + 200*(
(Count(id)- min(TOTAL Aggr(Count(id),Dimension)))
/
( max(TOTAL Aggr(Count(id),Dimension)) - min(TOTAL Aggr(Count(id),Dimension)))
) ,
0,
if(Avg(Revenue) > 0,255,0),
if(Avg(Revenue) <=0,255,0))
Regards
Andrew
- Mark as New
- Bookmark
- Subscribe
- Mute
- Subscribe to RSS Feed
- Permalink
- Report Inappropriate Content
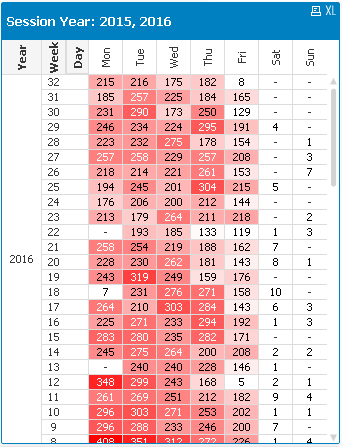
Try Gysberts "correct" reply to this thread - Qlikview Heatmaps
It helped me create a heatmap and uses the colormix function to produce a gradient.
- Mark as New
- Bookmark
- Subscribe
- Mute
- Subscribe to RSS Feed
- Permalink
- Report Inappropriate Content
Hi Mark,
The way I read this request (and I could be wrong) the colours are to be either green or blue. The intensity of the shade is to vary with count(id) and this is done by varying the first parameter of the ARGB expression. Of course goutham k may find that an expression based on a colour gradient using colormix suits his/her purposes better.
Cheers
Andrew
- Mark as New
- Bookmark
- Subscribe
- Mute
- Subscribe to RSS Feed
- Permalink
- Report Inappropriate Content
The only issue I have encountered in manually setting the ARGB value is that sometimes you have to fiddle about to keep the range between 0 and 255 and to have an even(ish) spread of colour. You also might have to apply some code to the Font Colour as well to get contrasting, i.e. easily readable text.
PS, Liking the Signals Picture! \m/ effinty2112
- Mark as New
- Bookmark
- Subscribe
- Mute
- Subscribe to RSS Feed
- Permalink
- Report Inappropriate Content
Hi James,
The points you made are good ones. To keep the transparency value in the right range I pick a number between 0 and 255 , usually 55 and follow this kind of scheme:
55 + 200*(Expression - min of Expression)/(max of Expression - min of Expression)
But when you write it out for real with actual expression and the inevitable aggr functions it can look a bit cumbersome.
You're right about the spread of the intensities, often it's not quite as effective on the screen as one would like (I find that with ColorMix too). You can replace the ratio (Expression - min of Expression)/(max of Expression - min of Expression) with something more complicated to emphasis differences in the middle or in the extremes of the range but you quickly reach a point of diminishing returns and have a very messy colour expression and little to show for it.
Your last point about heatmaps that display values in cells is something I always forget about until I get a table where I can only read half the values!
Kind regards
The Analog Kid
- Mark as New
- Bookmark
- Subscribe
- Mute
- Subscribe to RSS Feed
- Permalink
- Report Inappropriate Content
Thanks for the reply, I did nick your AGGR code and applied it to the heatmap shown in the post and it worked like a charm! 
A Working Man 
- Mark as New
- Bookmark
- Subscribe
- Mute
- Subscribe to RSS Feed
- Permalink
- Report Inappropriate Content
hi Andrew,
I am sorry for the late response. the expression what you have given helped me, but i have multiple charts with different expression. i want to see the unique color coding .
Like the max valued expression in chart one should have the same darker color as Max color in the second chart
Irrespective of their values
Eg:
For Count(id) in first chart i have a max value 50 and
For Count(id) in 2nd chart i have a max value 20.
Is it possible to see same darker color bars in both charts.
Please advise
- Mark as New
- Bookmark
- Subscribe
- Mute
- Subscribe to RSS Feed
- Permalink
- Report Inappropriate Content
Hi,
It's difficult to sort this for you at a distance so to speak but consider this. The expression I've suggested has this ratio at its heart:
(Count(id)- min(TOTAL Aggr(Count(id),Dimension)))
/
( max(TOTAL Aggr(Count(id),Dimension)) - min(TOTAL Aggr(Count(id),Dimension)))
When the Count(id) take its minimum value the top line will equal zero, the bottom line will not be zero so the ratio as a whole will equal zero. When Count(id) takes its maximum value the top line and the bottom line will be equal and non zero so the ratio will equal 1.
If you have two charts with a different count of id the ratio should still range between 0 and 1 if the Aggr expressions are doing their jobs. In two charts that are giving different shades for their max value of count(id) test the Aggr expressions by adding these expressions:
min(TOTAL Aggr(Count(id),Dimension))
and
max(TOTAL Aggr(Count(id),Dimension))
In fact I would copy your charts and change the copies to a straight table to see better what's going on. For the chart with maximum count of id as 50 you should find that max(TOTAL Aggr(Count(id),Dimension)) will return 50 across all the values of the dimension and return 20 for the other chart.
Please let me know how you get on.
Good luck
Andrew