Unlock a world of possibilities! Login now and discover the exclusive benefits awaiting you.
- Qlik Community
- :
- Forums
- :
- Analytics
- :
- New to Qlik Analytics
- :
- Re: Polygon Map at the Postcode Level For Australi...
- Subscribe to RSS Feed
- Mark Topic as New
- Mark Topic as Read
- Float this Topic for Current User
- Bookmark
- Subscribe
- Mute
- Printer Friendly Page
- Mark as New
- Bookmark
- Subscribe
- Mute
- Subscribe to RSS Feed
- Permalink
- Report Inappropriate Content
Polygon Map at the Postcode Level For Australia
Using the Maps Chart Object - Polygon Map - Part 2 - (video)
@Michael Tarallo - Is it possible to draw a polygon chart at the postcode level for whole Australia Using Qlik Sense?
I am stuck with this issue and no matter what I do , I get the error . If it is not possible then please do let me know and I will start concentrating on Qlik View . I am attaching the app and the data for your reference.
- Mark as New
- Bookmark
- Subscribe
- Mute
- Subscribe to RSS Feed
- Permalink
- Report Inappropriate Content
Have you tried everything in this thread
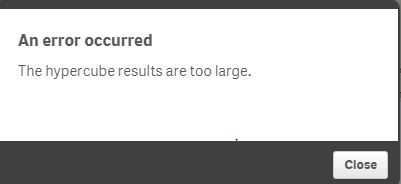
Qlik Sense Map Error: the hypercube results are too large"
including this
I eventually found this site for reducing the number of decimals
http://www.gearthblog.com/blog/archives/2016/03/making-kml-files-smaller-reducing-precision.html
It's free and did the job very quickly. Highland reduced from around 3 million characters to 1.5 million based on 5 decimal places. (4 distorted the map slightly or a lot with 3 or less). I also used "optimize KML file size" (US$20). It reduced the number of characters slightly for Highland but not much. But using both worked OK. That is reduce the decimal's to 5 and then run optimize.
I tried Qlik's geogetboundingbox with 15 decimal places but it still didn't work.
Re getAggrGeomentry. I tried this and it increased the number of decimals back up to 15. So instead I just grouped greater London using the visualization grouping facility. Even though it still showed the boundaries (like GetReduceGeometry).
- Mark as New
- Bookmark
- Subscribe
- Mute
- Subscribe to RSS Feed
- Permalink
- Report Inappropriate Content
Yes Robert,
I tried both of them.
1. If I use GeoAggrGeometry function then the data load runs for hours and ultimately it errors out and qlik sense dies.
2. After reducing the precision in the KML file, Qlik sense doesn't recognize the columns specified in the KML file.
Thanks
Aj
- Mark as New
- Bookmark
- Subscribe
- Mute
- Subscribe to RSS Feed
- Permalink
- Report Inappropriate Content
I guess you have too many areas (2513)
It works if I took areas starting with 0 then 1 then 2 etc. But if I add them together and it exceeds 1000 it doesn't. So maybe the maps can only handle an upper limit of areas.
I hope Qlik markedly improve mapping (including the documentation) in version 3. These maps are excellent but it can take forever to get them set up and working
- Mark as New
- Bookmark
- Subscribe
- Mute
- Subscribe to RSS Feed
- Permalink
- Report Inappropriate Content
Thanks Robert, Appreciate the response.
From which file you removed areas – KML or P_M_R_A_Final_Decile_W.csv. Because I need the maps only for the postcodes which are in the file P_M_R_A_Final_Decile_W.csv. And they are totally – 1321.
Thanks
Aj
- Mark as New
- Bookmark
- Subscribe
- Mute
- Subscribe to RSS Feed
- Permalink
- Report Inappropriate Content
LOAD1:
LOAD
"Australian Postcodes.Name",
IF (wildmatch ("Australian Postcodes.Name" , '3*' ) >0 , 'Are3' ,
if (wildmatch ("Australian Postcodes.Name" , '2*' ) , 'Area2',
if (wildmatch ("Australian Postcodes.Name" , '1*' ) > 0, 'Area1', 'other'))) as AreaCom ,
"Australian Postcodes.Point",
GeoGetBoundingBox ("Australian Postcodes.Area") as geoarea ,
"Australian Postcodes.Area"
FROM [lib://Downloads/AustKML\Data_And_App\Australian Postcodes.kml]
(kml, Table is [Australian Postcodes/Postcodes_Simplified])
WHERE wildmatch ("Australian Postcodes.Name" , '3*' , '2*' , '1*' )
//WHERE match ("Australian Postcodes.Name" , 3212)
;
If I just loaded starting with 0 it was fine. Likewise with 1 to 10. But combining 2 or more numbers ('3*' , '2*' , '1*') often did not work. As didn't the other options I tried
- Mark as New
- Bookmark
- Subscribe
- Mute
- Subscribe to RSS Feed
- Permalink
- Report Inappropriate Content
Hi Again Ajay. You have been busy on this issue.  Just so that community users can find their way to a solution from your various posts, I will put a couple of links here.
Please refer to my comments in this post: Re: Unable to Create Polygon Map for Australia
And the files attached to this post: Re: How to find Australian Postcode KML file
- Mark as New
- Bookmark
- Subscribe
- Mute
- Subscribe to RSS Feed
- Permalink
- Report Inappropriate Content
Hi Ajay
Use the KML [*reduced size] file i have posted in here.. Filename = Postcodes.kml
GeoAggrGeometry() - JSON protocol parse error
It will plot Australia postcodes.
There are also links to GDAL tool to reduce KML accuracy in order to get it working in QlikSense build-in MAp chart
hope this helps
cheers
Lech
- Mark as New
- Bookmark
- Subscribe
- Mute
- Subscribe to RSS Feed
- Permalink
- Report Inappropriate Content
Thanks Lech,
We ultimately used GDAL tool to fix that issue. Appreciate your response.
Regards
Ajay