Unlock a world of possibilities! Login now and discover the exclusive benefits awaiting you.
- Qlik Community
- :
- Forums
- :
- Analytics
- :
- New to Qlik Analytics
- :
- Re: 100% stack bar chart
- Subscribe to RSS Feed
- Mark Topic as New
- Mark Topic as Read
- Float this Topic for Current User
- Bookmark
- Subscribe
- Mute
- Printer Friendly Page
- Mark as New
- Bookmark
- Subscribe
- Mute
- Subscribe to RSS Feed
- Permalink
- Report Inappropriate Content
100% stack bar chart
Hi All,
I am working on creating 100 % stack bar chart.
i have selected dimensions as week and category
category includes
IF (Aggr(Sum(AMOUNT_CLIENT), [CLIENT],[YEAR],[WEEK]) < 10, 'Spender 1')
this if conditions different types of spenders.
my measure has count(distinct client)
value wise data is displayed fine but i want to convert the value into % (100 % stack bar chart)
can some one pls suggest .
- Mark as New
- Bookmark
- Subscribe
- Mute
- Subscribe to RSS Feed
- Permalink
- Report Inappropriate Content
Hi,
Its very urgent, Please help me out.
- Mark as New
- Bookmark
- Subscribe
- Mute
- Subscribe to RSS Feed
- Permalink
- Report Inappropriate Content
Would you be able to share a sample?
- Mark as New
- Bookmark
- Subscribe
- Mute
- Subscribe to RSS Feed
- Permalink
- Report Inappropriate Content
sample? how do you want that? any specific format?
- Mark as New
- Bookmark
- Subscribe
- Mute
- Subscribe to RSS Feed
- Permalink
- Report Inappropriate Content
Hi
use following for getting 100% for Max ...
First expression :
Sum(AMOUNT_CLIENT)
Second expression
Sum(AMOUNT_CLIENT)
/
Max(TOTAL Aggr(Sum (AMOUNT_CLIENT)
, [CLIENT],[YEAR],[WEEK]))
- Mark as New
- Bookmark
- Subscribe
- Mute
- Subscribe to RSS Feed
- Permalink
- Report Inappropriate Content
Hi,
Where shall i keep this expressions?
- Mark as New
- Bookmark
- Subscribe
- Mute
- Subscribe to RSS Feed
- Permalink
- Report Inappropriate Content
Its coming as NULL Now.
- Mark as New
- Bookmark
- Subscribe
- Mute
- Subscribe to RSS Feed
- Permalink
- Report Inappropriate Content
a qvf file or excel data with your expected output will be helpful
- Mark as New
- Bookmark
- Subscribe
- Mute
- Subscribe to RSS Feed
- Permalink
- Report Inappropriate Content
- Mark as New
- Bookmark
- Subscribe
- Mute
- Subscribe to RSS Feed
- Permalink
- Report Inappropriate Content
no option of attaching the file.
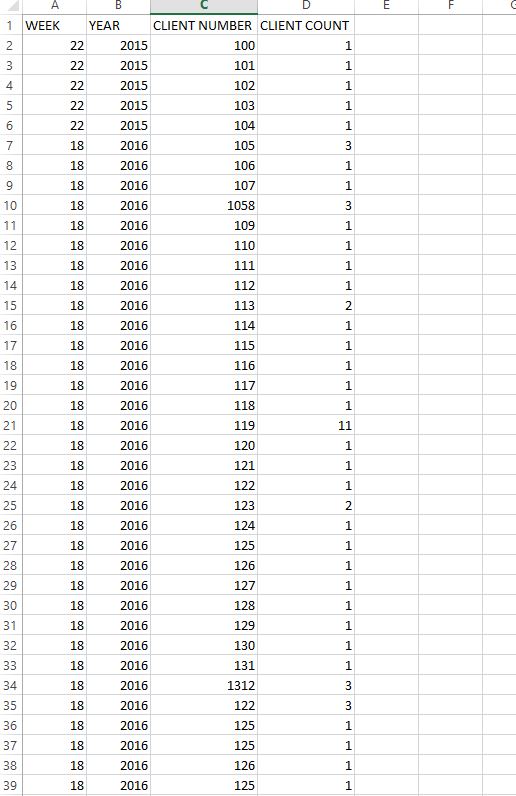
In the above screen.
at a week year level i have to show them 100 percent stack bar chart
condition being the last column.
if client count is 1 then 1st bucket, if client count is between 2 to 4 then 2nd bucket and so on..
- Mark as New
- Bookmark
- Subscribe
- Mute
- Subscribe to RSS Feed
- Permalink
- Report Inappropriate Content
Check here to see how you can upload samples: