Unlock a world of possibilities! Login now and discover the exclusive benefits awaiting you.
- Qlik Community
- :
- All Forums
- :
- QlikView App Dev
- :
- Re: How to convert Striaght Table into Bar chart ?
- Subscribe to RSS Feed
- Mark Topic as New
- Mark Topic as Read
- Float this Topic for Current User
- Bookmark
- Subscribe
- Mute
- Printer Friendly Page
- Mark as New
- Bookmark
- Subscribe
- Mute
- Subscribe to RSS Feed
- Permalink
- Report Inappropriate Content
How to convert Striaght Table into Bar chart ?
Hi All
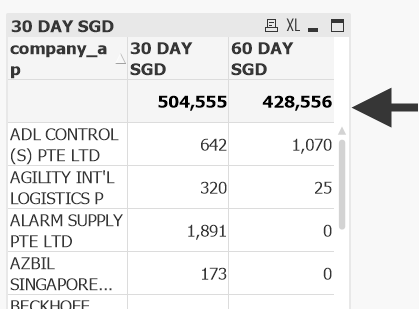
I have a striaght table , it have 2 column of value at Total by column.
I like to plot it using bar chart. To show 2 bar.
X Axis have 2 label , 30 Days and 60 Days.
Y Axis i need it display 504,555 for 30 days and 428,446 for 60days.
Hope some one can advise me.
Paul
- Tags:
- qlikview_scripting
Accepted Solutions
- Mark as New
- Bookmark
- Subscribe
- Mute
- Subscribe to RSS Feed
- Permalink
- Report Inappropriate Content
Hi
you dont have dimensions for those bars but you could leave the chart dimensionless like in the attached. I am not sure if this is what you mean though
- Mark as New
- Bookmark
- Subscribe
- Mute
- Subscribe to RSS Feed
- Permalink
- Report Inappropriate Content
My QVW
- Mark as New
- Bookmark
- Subscribe
- Mute
- Subscribe to RSS Feed
- Permalink
- Report Inappropriate Content
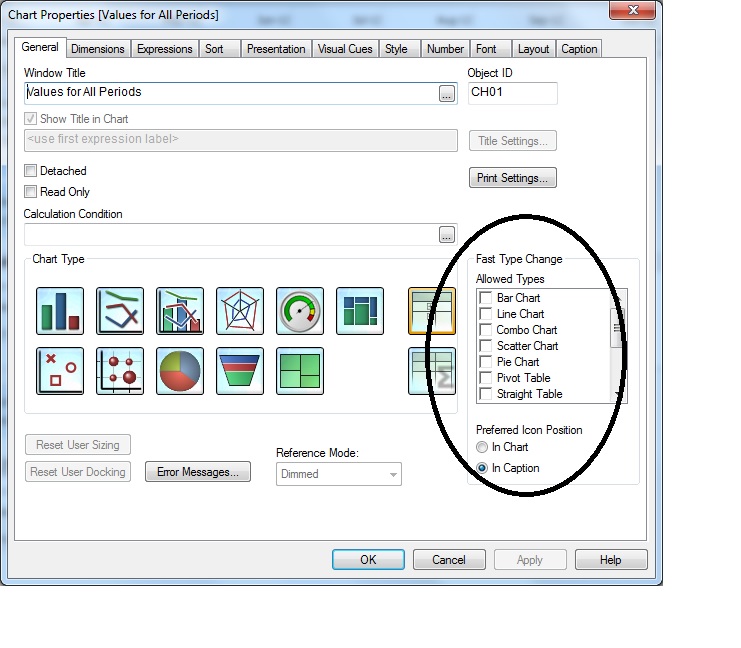
You can convert the chart type by going to the General tab and selecting a different chart type.
Or if you want to be able to change between different chart types, tick the relevant boxes in the Fast Type Change box also on the General tab
- Mark as New
- Bookmark
- Subscribe
- Mute
- Subscribe to RSS Feed
- Permalink
- Report Inappropriate Content
Hi Kenny
Thank you for your sharing, But my table is unique , it is unable just convert by click.
Paul
- Mark as New
- Bookmark
- Subscribe
- Mute
- Subscribe to RSS Feed
- Permalink
- Report Inappropriate Content
What is 504,555 and 428,446 ??
- Mark as New
- Bookmark
- Subscribe
- Mute
- Subscribe to RSS Feed
- Permalink
- Report Inappropriate Content
Hi Balraj , Below is the table value , thank you for your sharing.
- Mark as New
- Bookmark
- Subscribe
- Mute
- Subscribe to RSS Feed
- Permalink
- Report Inappropriate Content
Hi
you dont have dimensions for those bars but you could leave the chart dimensionless like in the attached. I am not sure if this is what you mean though
- Mark as New
- Bookmark
- Subscribe
- Mute
- Subscribe to RSS Feed
- Permalink
- Report Inappropriate Content
Hi Tracy
Your solution very creative.
thank you very much.
Paul
- Mark as New
- Bookmark
- Subscribe
- Mute
- Subscribe to RSS Feed
- Permalink
- Report Inappropriate Content
Hi,
just use fast change
HTH
André Gomes
- Mark as New
- Bookmark
- Subscribe
- Mute
- Subscribe to RSS Feed
- Permalink
- Report Inappropriate Content
Thank you Andre , it does not work by just click . need to put the expression from table to bar chart. I already got the solution. thank you.