Unlock a world of possibilities! Login now and discover the exclusive benefits awaiting you.
- Qlik Community
- :
- All Forums
- :
- QlikView App Dev
- :
- Re: Non continuous line in chart
- Subscribe to RSS Feed
- Mark Topic as New
- Mark Topic as Read
- Float this Topic for Current User
- Bookmark
- Subscribe
- Mute
- Printer Friendly Page
- Mark as New
- Bookmark
- Subscribe
- Mute
- Subscribe to RSS Feed
- Permalink
- Report Inappropriate Content
Non continuous line in chart
Hi, I have some charts in Excel that I want to make them again in Qlikview.
In particular I have a line chart in Excel that has null values in it. In that case the chart shows breaks in the line. I tried to draw a line chart in Qlikview with that behaviour with no luck. I think that is not possible to do that in Qlikview. Does anyone have the same problem???
I attached an example chart from Excel that I want to reproduce. It includes all the values to draw it.
Thanks!
Accepted Solutions
- Mark as New
- Bookmark
- Subscribe
- Mute
- Subscribe to RSS Feed
- Permalink
- Report Inappropriate Content
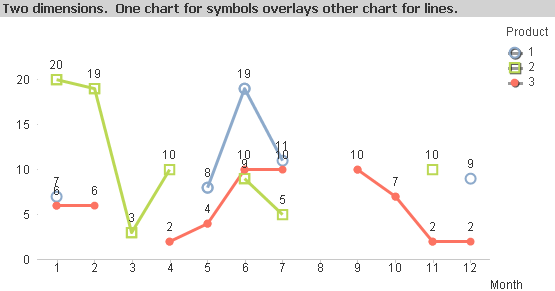
The attached file has examples for both a single dimension and two dimensions. They're not particularly straightforward, involving separate expressions for data points and lines, and then checking if the segment should be drawn by checking both points, and setting the color of the line to transparent if one of the points is missing. The two dimension case is even more complicated, with an additional data table and overlaying two charts.
So... not really supported in QlikView, but with enough effort, you can fake it up to look like you want.
- Mark as New
- Bookmark
- Subscribe
- Mute
- Subscribe to RSS Feed
- Permalink
- Report Inappropriate Content
Hi,
You can check this example if that what you want
Best Regards.
- Mark as New
- Bookmark
- Subscribe
- Mute
- Subscribe to RSS Feed
- Permalink
- Report Inappropriate Content
Hey Hi,
You can use '<s1>' in the line style under the expression tab.
Regards
- Mark as New
- Bookmark
- Subscribe
- Mute
- Subscribe to RSS Feed
- Permalink
- Report Inappropriate Content
Hi mona_qlik! Thanks for your answer... but I can't open the file. It seems to be broken, Qlikview says it cannot load that file. Could you upload a checked version of it again??
Regards!
- Mark as New
- Bookmark
- Subscribe
- Mute
- Subscribe to RSS Feed
- Permalink
- Report Inappropriate Content
The attached file has examples for both a single dimension and two dimensions. They're not particularly straightforward, involving separate expressions for data points and lines, and then checking if the segment should be drawn by checking both points, and setting the color of the line to transparent if one of the points is missing. The two dimension case is even more complicated, with an additional data table and overlaying two charts.
So... not really supported in QlikView, but with enough effort, you can fake it up to look like you want.
- Mark as New
- Bookmark
- Subscribe
- Mute
- Subscribe to RSS Feed
- Permalink
- Report Inappropriate Content
Thank you John! It worked perfectly.
It's a pity that Qlikview is not capable of doing that transparently.
Thanks for sharing your knowledge in Qlikview!!!
Regards,
Ramiro!
- Mark as New
- Bookmark
- Subscribe
- Mute
- Subscribe to RSS Feed
- Permalink
- Report Inappropriate Content
Hi Rahul,
I don't see this option; could you please elaborate?
Thanks,
AP
- Mark as New
- Bookmark
- Subscribe
- Mute
- Subscribe to RSS Feed
- Permalink
- Report Inappropriate Content
Rahul,
That just sets the line style to continuous, dotted, dashed, etc. It does not inhibit the line from continuing when a null datapoint is encountered.
Brian
- Mark as New
- Bookmark
- Subscribe
- Mute
- Subscribe to RSS Feed
- Permalink
- Report Inappropriate Content
any way for me to load .qvw to QlikSense (doesn't show that file type is supported), you have in PDF/txt version? thanks
- Mark as New
- Bookmark
- Subscribe
- Mute
- Subscribe to RSS Feed
- Permalink
- Report Inappropriate Content
Could you please share expression used in color to make it transparent for Qlik sense