Unlock a world of possibilities! Login now and discover the exclusive benefits awaiting you.
- Qlik Community
- :
- Forums
- :
- Analytics
- :
- New to Qlik Analytics
- :
- Bar Chart - Color by expression
- Subscribe to RSS Feed
- Mark Topic as New
- Mark Topic as Read
- Float this Topic for Current User
- Bookmark
- Subscribe
- Mute
- Printer Friendly Page
- Mark as New
- Bookmark
- Subscribe
- Mute
- Subscribe to RSS Feed
- Permalink
- Report Inappropriate Content
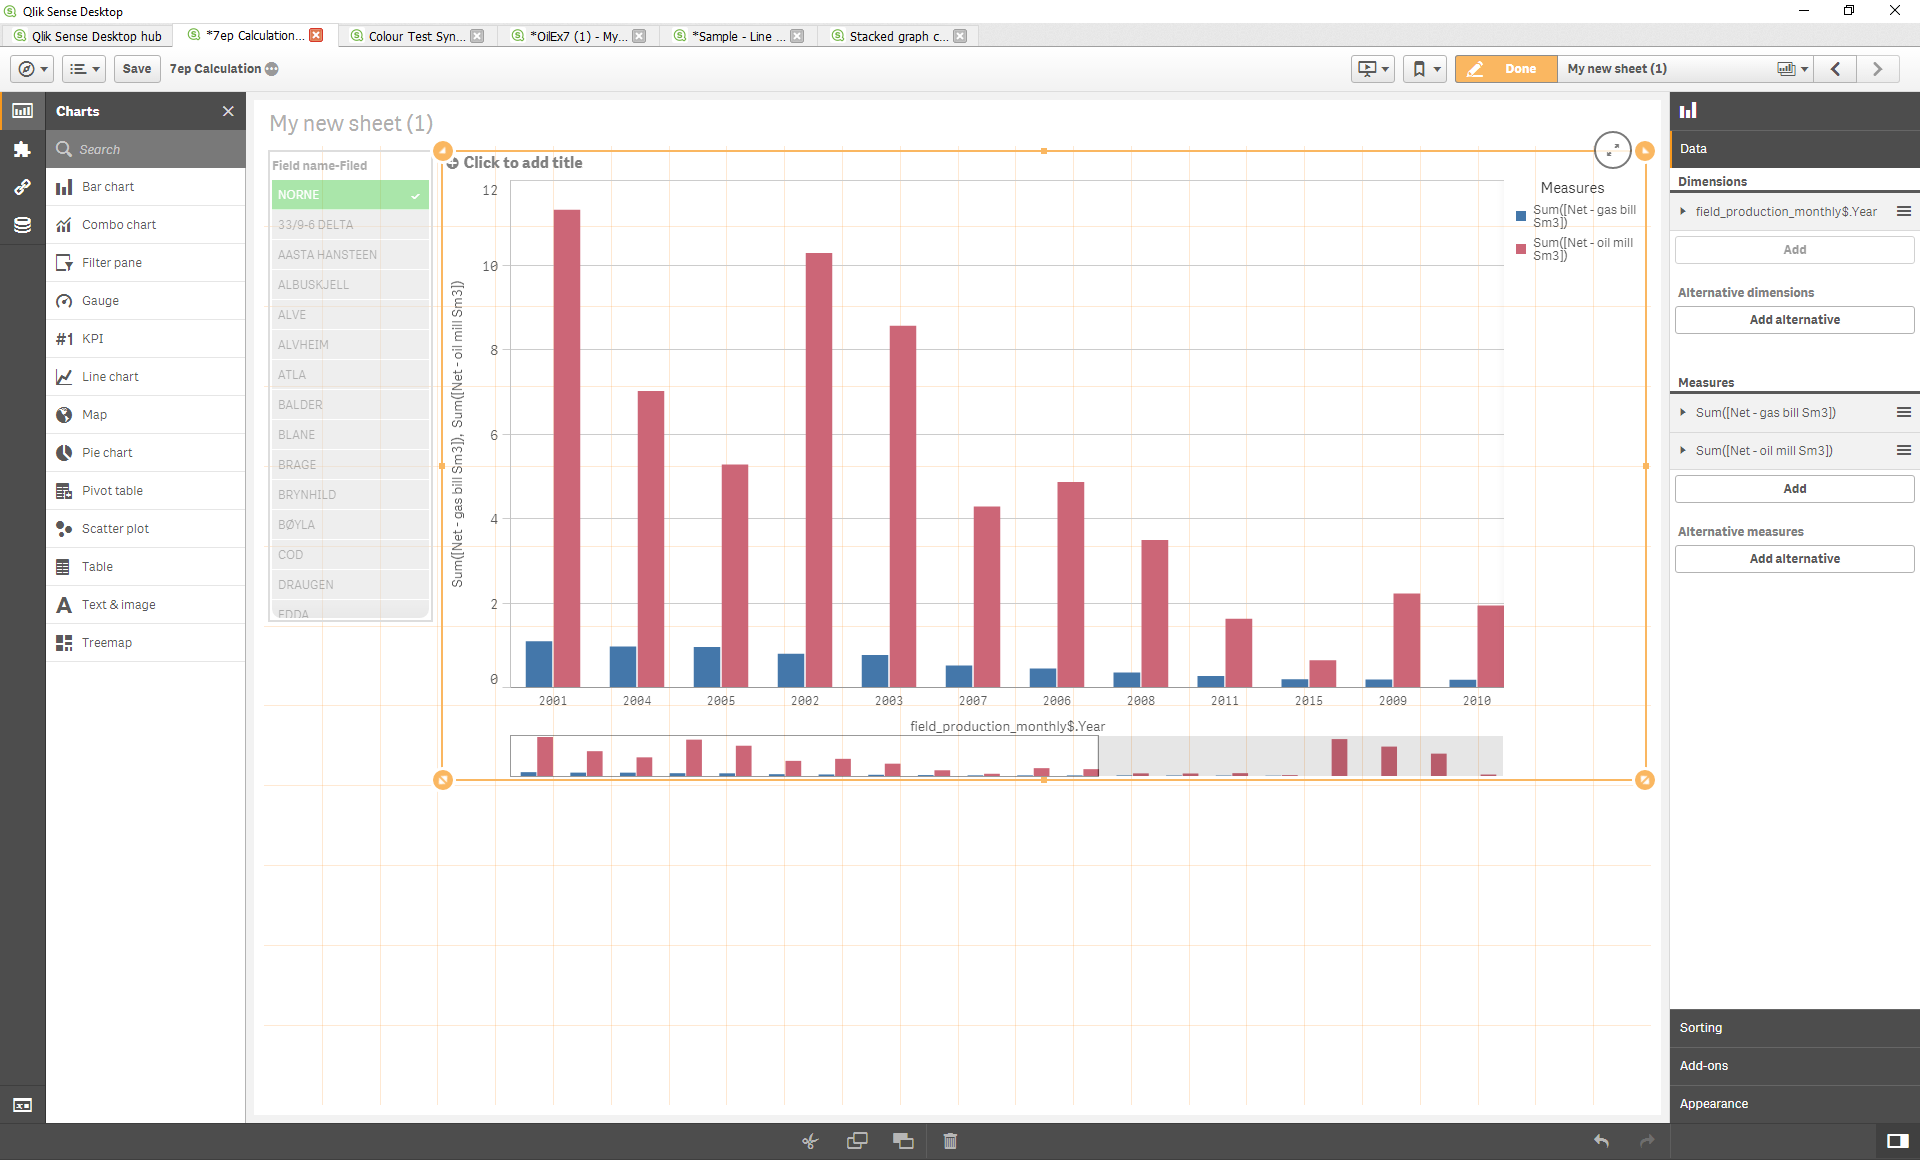
Bar Chart - Color by expression
Hi all,
I know that similar questions have been asked before and I have tried to follow the suggestions, but I still struggle to define colours to the different bars in my chart.
I would like to define the different colours to the different measurements in my bar chart (oil and ags) using colour by expression. Oil should be green and gas should be red.
Hopefully some uf you can help me
Cheers
Helge
- Mark as New
- Bookmark
- Subscribe
- Mute
- Subscribe to RSS Feed
- Permalink
- Report Inappropriate Content
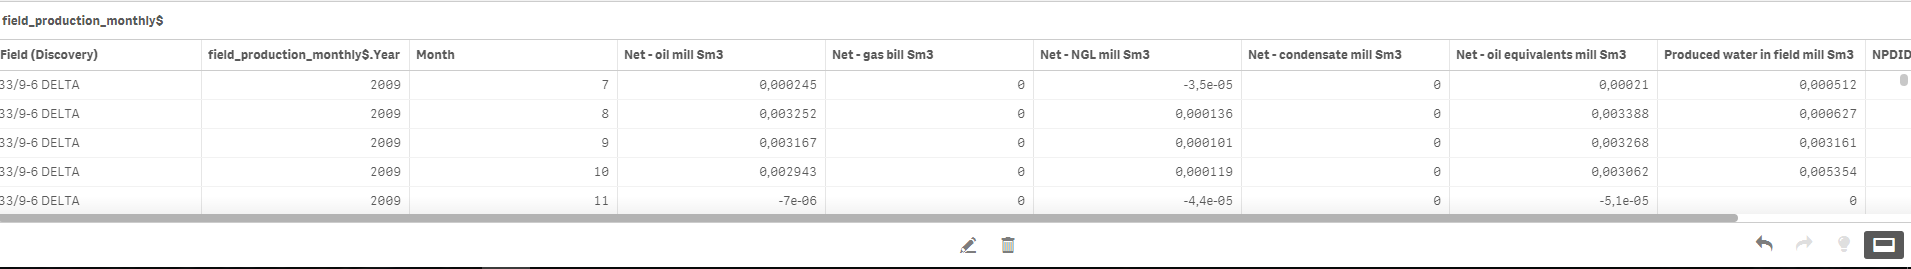
Do you have a dimension (or can you create a dimension) where you can tell if it is gas or oil?
maybe it also works on a measruement, but i'm not sure, never tried.
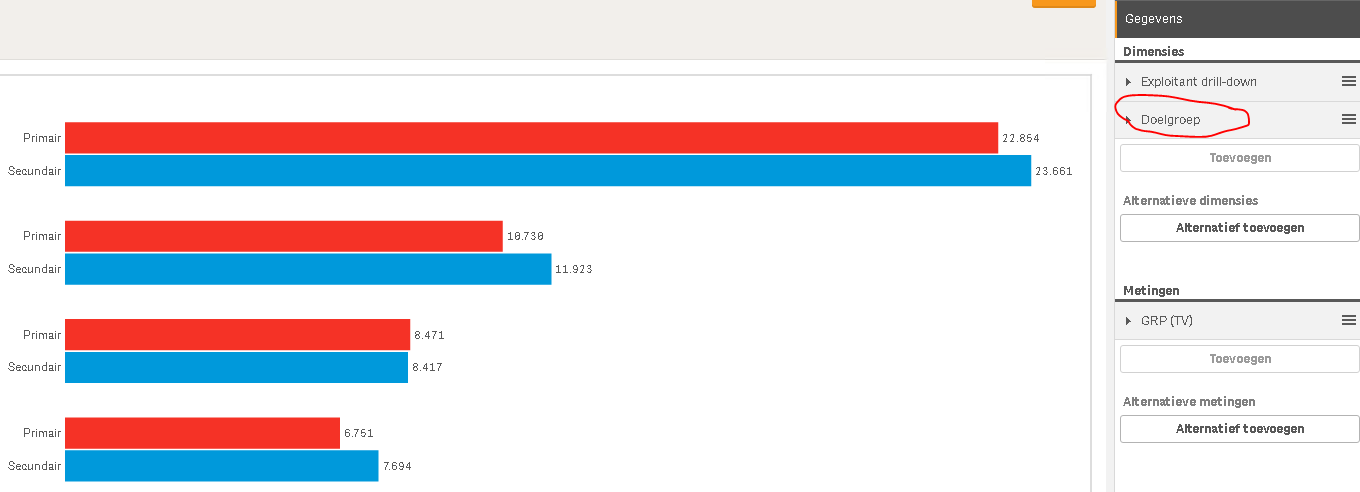
Here is my example:
I have a dimension "Doelgroep", on which i coloured my measures, like this:
I used this code for coloring the measures:
if(Doelgroep = 'Primair',vRed,
if(Doelgroep = 'Secundair',vBlue))
I put the code here
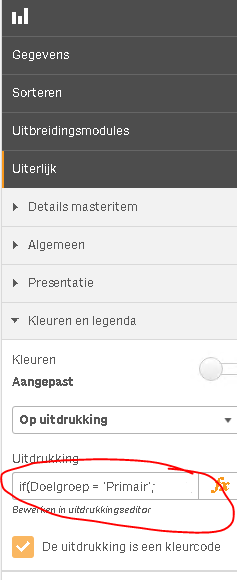
(Op uitdrukking = On expresion || Uiterlijk = Appearance)
Don;t forget the box "expression is a colorcode" (or whatever it may be in English).
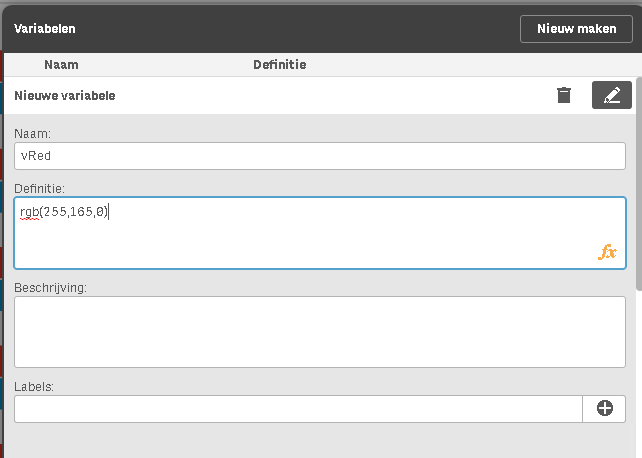
I declared to variables with the Hex codes, you don't have to do this, It is just a normal Hex code:
Does this help?