Unlock a world of possibilities! Login now and discover the exclusive benefits awaiting you.
- Qlik Community
- :
- All Forums
- :
- QlikView App Dev
- :
- Re: Changing line color in Line Graph
- Subscribe to RSS Feed
- Mark Topic as New
- Mark Topic as Read
- Float this Topic for Current User
- Bookmark
- Subscribe
- Mute
- Printer Friendly Page
- Mark as New
- Bookmark
- Subscribe
- Mute
- Subscribe to RSS Feed
- Permalink
- Report Inappropriate Content
Changing line color in Line Graph
Hello,
I am struggling to change the color of lines in my line graph with 3 lines. I know this can be changed using "colors by expression" option but not sure how to write an expression.
The data in my line chart looks like below (example) -
Dates aPlanned aComplete aReview
12/09/2016 10 8 5
13/09/2016 10 9 6
14/09/2016 11 10 6
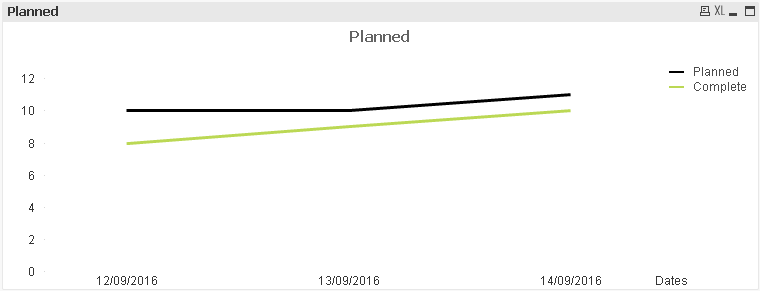
I would like to give Black color to Planned and Green to complete (just an example). Can anyone please help me here. Thanks
Sonal
- « Previous Replies
-
- 1
- 2
- Next Replies »
- Mark as New
- Bookmark
- Subscribe
- Mute
- Subscribe to RSS Feed
- Permalink
- Report Inappropriate Content
Is this whats you are willing to achieve??
- Mark as New
- Bookmark
- Subscribe
- Mute
- Subscribe to RSS Feed
- Permalink
- Report Inappropriate Content
Hi Sonal,
Can you view the below link shared by Posted by amz
Line Chart tricks: Displaying what's important
I hope it helps you.
Thanks
Kumar
- Mark as New
- Bookmark
- Subscribe
- Mute
- Subscribe to RSS Feed
- Permalink
- Report Inappropriate Content
There is how to can accomplish your needs:
- Mark as New
- Bookmark
- Subscribe
- Mute
- Subscribe to RSS Feed
- Permalink
- Report Inappropriate Content
please post a sample application to demonstrate with
thanks
regards
Marco
- Mark as New
- Bookmark
- Subscribe
- Mute
- Subscribe to RSS Feed
- Permalink
- Report Inappropriate Content
Hello Saima,
Thanks, this looks helpful. How did you manage to get green and black line colors? Please note that i am using QlikSense Desktop and need expression to change colors.
- Mark as New
- Bookmark
- Subscribe
- Mute
- Subscribe to RSS Feed
- Permalink
- Report Inappropriate Content
Is this Qliksense Desktop? Sorry i am too new to this.
- Mark as New
- Bookmark
- Subscribe
- Mute
- Subscribe to RSS Feed
- Permalink
- Report Inappropriate Content
IS this Qliksense Desktop? I don't see this option in my tool. Can you please help me locate? Thanks
- Mark as New
- Bookmark
- Subscribe
- Mute
- Subscribe to RSS Feed
- Permalink
- Report Inappropriate Content
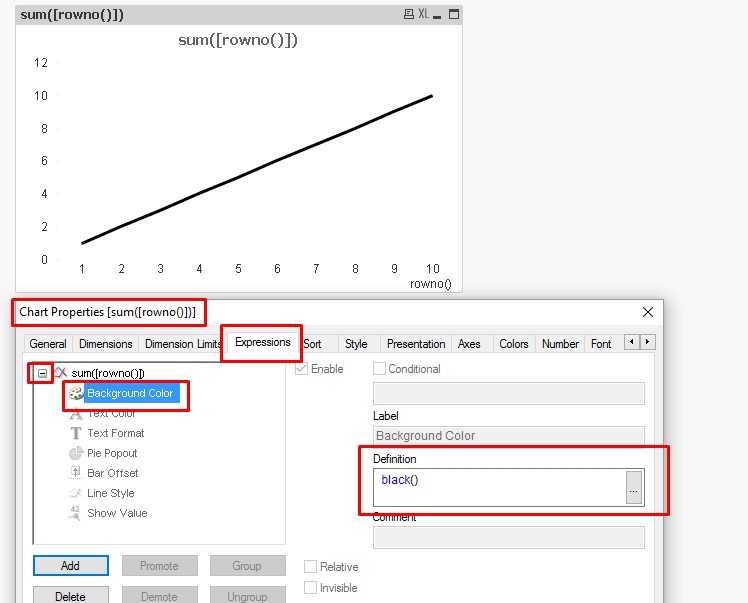
Hi Sonal,
This is not for Qlik sense . It is for Qlikview.
Line chart properties:
Hope this could help you.
Thanks
Kumar KVP
- Mark as New
- Bookmark
- Subscribe
- Mute
- Subscribe to RSS Feed
- Permalink
- Report Inappropriate Content
Color by expression for two different measures in a Combo Chart
For Qlik Sense the color coding is limited and you can only edit colors by
chart Properties>Colors and Legend>Custom Color>By Expression.
- « Previous Replies
-
- 1
- 2
- Next Replies »