Unlock a world of possibilities! Login now and discover the exclusive benefits awaiting you.
- Qlik Community
- :
- Forums
- :
- Analytics
- :
- New to Qlik Analytics
- :
- Re: Set Analysis in Pivot table
- Subscribe to RSS Feed
- Mark Topic as New
- Mark Topic as Read
- Float this Topic for Current User
- Bookmark
- Subscribe
- Mute
- Printer Friendly Page
- Mark as New
- Bookmark
- Subscribe
- Mute
- Subscribe to RSS Feed
- Permalink
- Report Inappropriate Content
Set Analysis in Pivot table
Hi All,
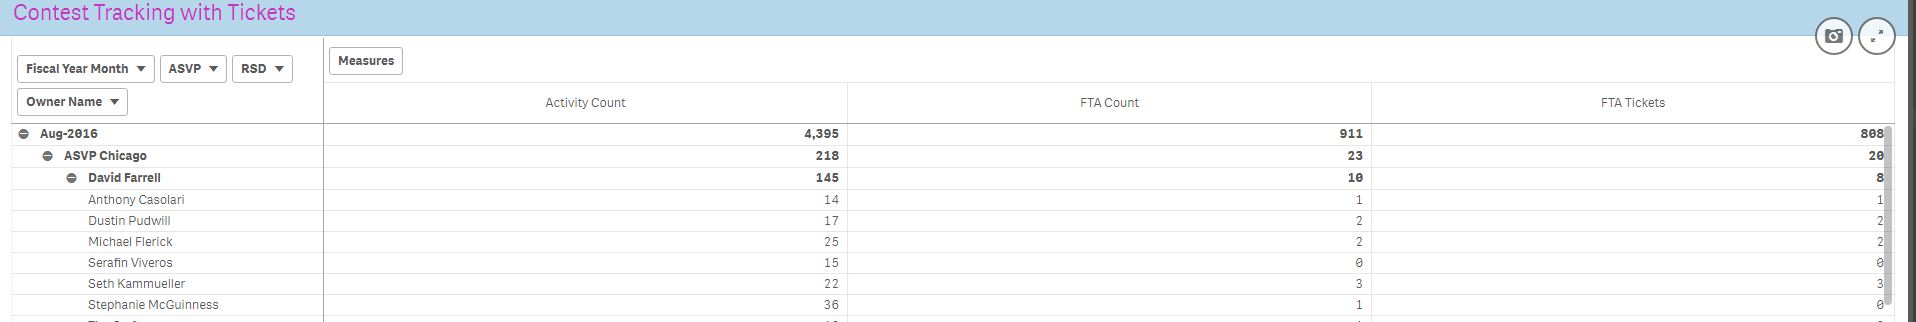
I am trying to create set Analysis in my pivot table as one of the measure. I have following fields in the data table: Seller Type, Seller Name, FTACount. Seller Type has values Bank NSE, MMSE, MSE. I want to calculate: Total Tickets for all seller with Seller name based on following criteria:
If [Seller Type]= 'Bank NSE' and Count(FTACount) >= 40 then result = 3 ticket
If [Seller Type]= 'MSE' and Count(FTACount) >=8 then result = 3 ticket
If [Seller Type]= 'MMSE' and Count(FTACount) >= 4 then result = 3 ticket
Below is the Set Analysis I have attempted so far and is very far from what I am trying to achieve:
IF([Seller Type] = 'Bank NSE', Count({$<[FTACount] > {39}>}FTACount))
Can anyone please hep?
Thanks,
Monica
- Mark as New
- Bookmark
- Subscribe
- Mute
- Subscribe to RSS Feed
- Permalink
- Report Inappropriate Content
What is your dimension for this chart where you are checking Count(FTACount) >= 40?
- Mark as New
- Bookmark
- Subscribe
- Mute
- Subscribe to RSS Feed
- Permalink
- Report Inappropriate Content
Maybe try this:
IF([Seller Type] = 'Bank NSE' And Aggr(Count([FTACount]), [Seller Type]) >= 40, '3 ticket')
This is only for one condition, you need to expand it to accommodate the other ones.
Hope this helps.
- Mark as New
- Bookmark
- Subscribe
- Mute
- Subscribe to RSS Feed
- Permalink
- Report Inappropriate Content
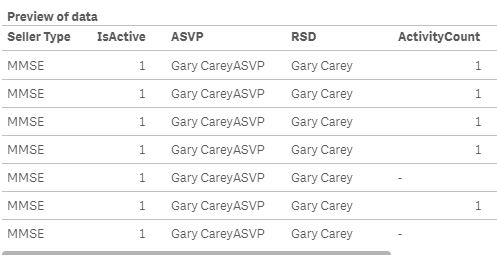
Context is important so please post some sample lines of data, the dimensions of your pivot table and the requested result.
You can try maybe something like
Count({$<[Seller Name] = {"=Count(FTACount) >= Pick(Match([Seller Type],'Bank NSE','MSE','MMSE'),40,8,4)"} >}
FTACount)
- Mark as New
- Bookmark
- Subscribe
- Mute
- Subscribe to RSS Feed
- Permalink
- Report Inappropriate Content
Below are the 3 images - First one with the Pivot table and last 2 with the fields of the Data model viewer with the field list and records.