Unlock a world of possibilities! Login now and discover the exclusive benefits awaiting you.
- Qlik Community
- :
- All Forums
- :
- QlikView App Dev
- :
- Re: How to calculate average over a range of data?
- Subscribe to RSS Feed
- Mark Topic as New
- Mark Topic as Read
- Float this Topic for Current User
- Bookmark
- Subscribe
- Mute
- Printer Friendly Page
- Mark as New
- Bookmark
- Subscribe
- Mute
- Subscribe to RSS Feed
- Permalink
- Report Inappropriate Content
How to calculate average over a range of data?
Hello,
I have a requirement where in i need to create a line graph which shows the average usage of licenses per day. Now the problem is, i have a "Time" field which has data for every 15 mins. This "Time" has data for entire day (i.e. from early morning 12 AM to midnight 11:59 PM). Now i need to calculate the average for only working hours say, from 8 AM to 8 PM per day.
If i calculate average for the entire day considering the Time from morning till evening, it would depict a wrong average, as the licenses will not be utilized for half of the day. So how can i pick up just that Time for a day and calculate the average license utilization over a day?
Any idea?
Thank you.
- « Previous Replies
-
- 1
- 2
- Next Replies »
- Mark as New
- Bookmark
- Subscribe
- Mute
- Subscribe to RSS Feed
- Permalink
- Report Inappropriate Content
Please try to share some sample data ,it would be helpful
- Mark as New
- Bookmark
- Subscribe
- Mute
- Subscribe to RSS Feed
- Permalink
- Report Inappropriate Content
Hello Stefan,
I have attached the image which describes the situation.
Thank you.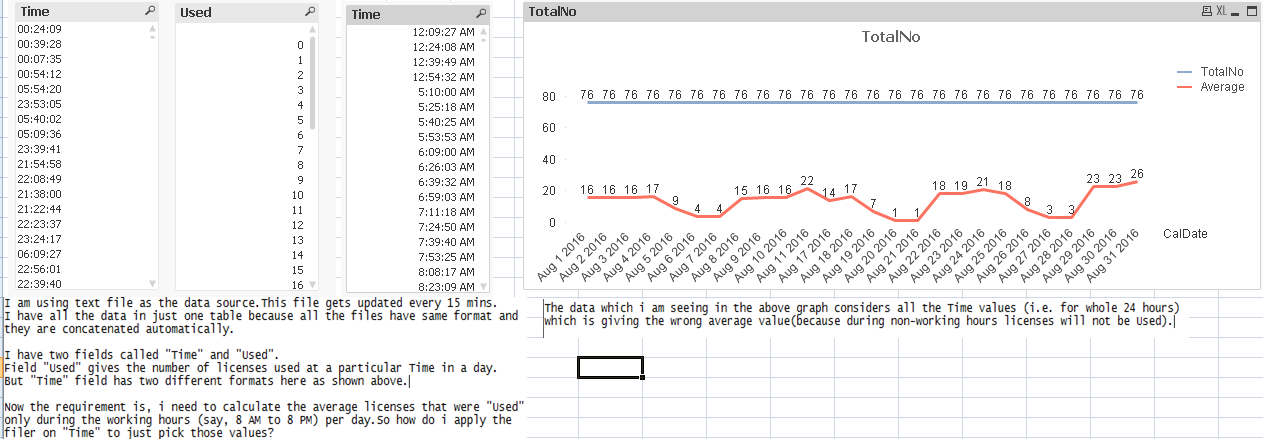
- « Previous Replies
-
- 1
- 2
- Next Replies »