Unlock a world of possibilities! Login now and discover the exclusive benefits awaiting you.
- Qlik Community
- :
- All Forums
- :
- QlikView App Dev
- :
- Re: Chart dimensions not filtering
- Subscribe to RSS Feed
- Mark Topic as New
- Mark Topic as Read
- Float this Topic for Current User
- Bookmark
- Subscribe
- Mute
- Printer Friendly Page
- Mark as New
- Bookmark
- Subscribe
- Mute
- Subscribe to RSS Feed
- Permalink
- Report Inappropriate Content
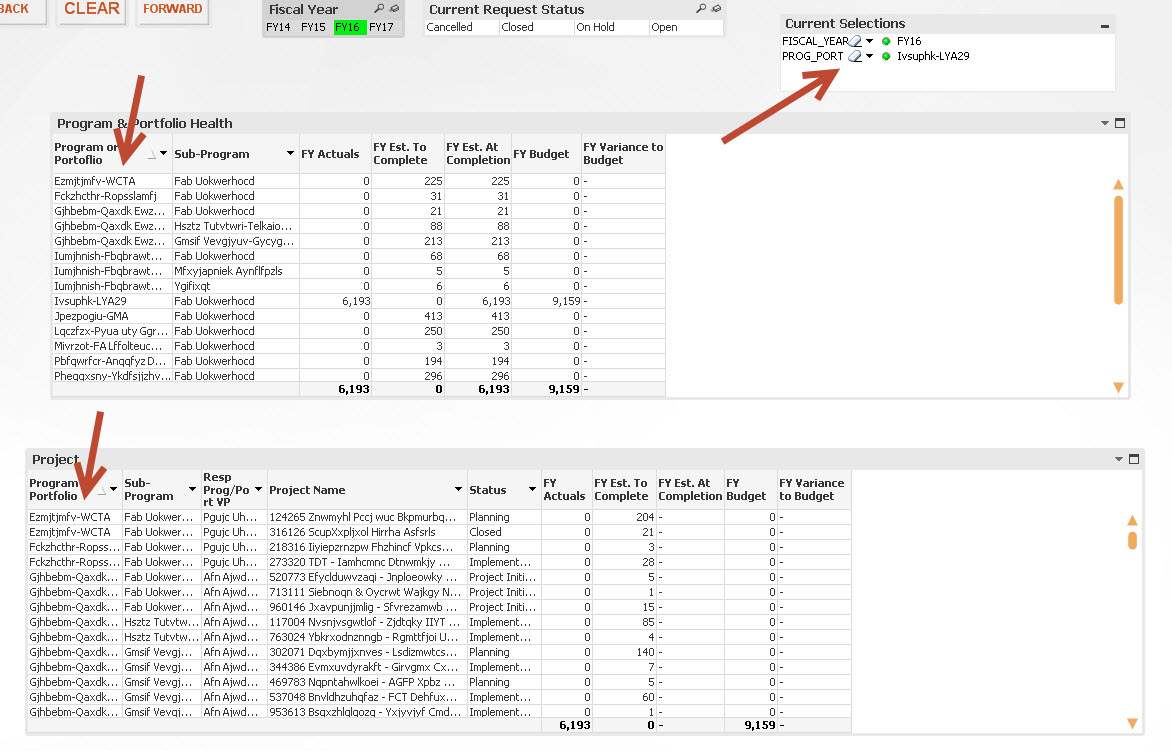
Chart dimensions not filtering
If you select FY16 and a PROG_PORT selection (first column in both tables), the charts are not reflecting only the rows in that selection. Not sure what is wrong but it didn't used to do this.
- « Previous Replies
-
- 1
- 2
- Next Replies »
- Mark as New
- Bookmark
- Subscribe
- Mute
- Subscribe to RSS Feed
- Permalink
- Report Inappropriate Content
Sounds good 
- Mark as New
- Bookmark
- Subscribe
- Mute
- Subscribe to RSS Feed
- Permalink
- Report Inappropriate Content
In my sample, I had disabled the Status expressions. In my actual file, with these enabled in the Program level graph, the filer on Program doesn't work. If I add the *avg(1) for all status fields, the filter works but the status fields are no longer displayed since their values are not numeric. Thoughts?
Scope Status:
=(if([CUR_PROG_SCOPE_HEALTH] = 'Green' , 'qmem://<bundled>/BuiltIn/check_g.png'
,if([CUR_PROG_SCOPE_HEALTH] = 'Yellow', 'qmem://<bundled>/BuiltIn/exclamation_y.png'
,if([CUR_PROG_SCOPE_HEALTH] = 'Red', 'qmem://<bundled>/BuiltIn/cross_r.png'
, 'qmem://<bundled>/BuiltIn/minus.png'
))))*avg(1)
- Mark as New
- Bookmark
- Subscribe
- Mute
- Subscribe to RSS Feed
- Permalink
- Report Inappropriate Content
Use an if statement
If(Column(1) > 0,
=(if([CUR_PROG_SCOPE_HEALTH] = 'Green' , 'qmem://<bundled>/BuiltIn/check_g.png'
,if([CUR_PROG_SCOPE_HEALTH] = 'Yellow', 'qmem://<bundled>/BuiltIn/exclamation_y.png'
,if([CUR_PROG_SCOPE_HEALTH] = 'Red', 'qmem://<bundled>/BuiltIn/cross_r.png'
, 'qmem://<bundled>/BuiltIn/minus.png'
)))))
Where you check in another column if that column is greater than 0 or not.
- Mark as New
- Bookmark
- Subscribe
- Mute
- Subscribe to RSS Feed
- Permalink
- Report Inappropriate Content
Thank you so much!
- « Previous Replies
-
- 1
- 2
- Next Replies »