Unlock a world of possibilities! Login now and discover the exclusive benefits awaiting you.
- Qlik Community
- :
- Forums
- :
- Analytics
- :
- New to Qlik Analytics
- :
- Re: Dimension values in a Pie Chart
- Subscribe to RSS Feed
- Mark Topic as New
- Mark Topic as Read
- Float this Topic for Current User
- Bookmark
- Subscribe
- Mute
- Printer Friendly Page
- Mark as New
- Bookmark
- Subscribe
- Mute
- Subscribe to RSS Feed
- Permalink
- Report Inappropriate Content
Dimension values in a Pie Chart
I try to migrate a QlikView application in QlikSense for a customer and they use a lot of pie chart. I create the pie chart easily in Sense but for the appearance part I have questions :
- Is it possible to hide dimension label if I use the legend ? If the legend is activated, I have the dimension label near the pie. So I have the same information twice.
- Is it possible to have the value and the percentage in the pie chart instead only value or percentage ?
Regards,
Stephane.
Accepted Solutions
- Mark as New
- Bookmark
- Subscribe
- Mute
- Subscribe to RSS Feed
- Permalink
- Report Inappropriate Content
Dear Stephane,
It's my misunderstanding. Now I see your point. This is not available now in Qlik Sense. I already forward your wishes to our Product team.
For now, you have to bear with that for a while, unfortunately. But thank you for bringing us the idea.
Best wishes,
Bohua
- Mark as New
- Bookmark
- Subscribe
- Mute
- Subscribe to RSS Feed
- Permalink
- Report Inappropriate Content
Dear Stéphane,
For your questions:
These answers uses some tricks to achieve the result you want, though.
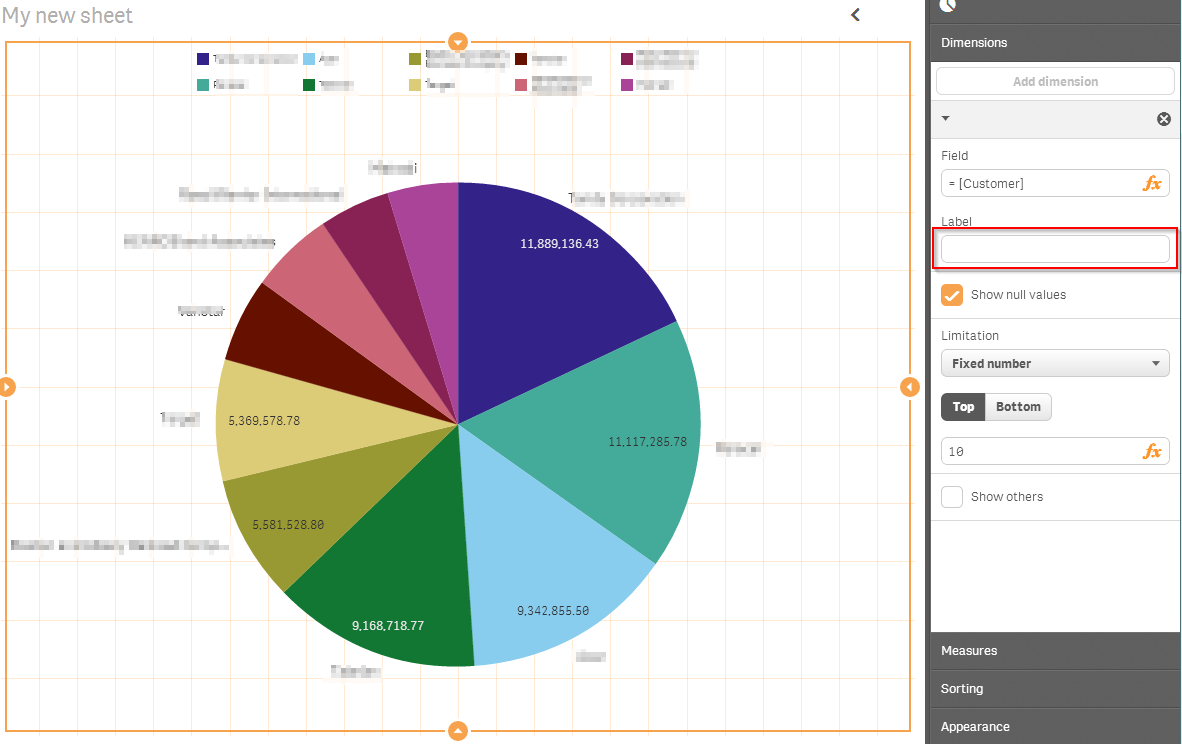
1. Yes, you can hide the dimension label by giving a empty (a space) Label in Property panel. (You cannot use a master dimension for this trick, you need to break the link if you are using any)
2. We don't have this option for 1.0 and I have no idea if would have that, unfortunately. And currently, without 'expression label' function in Qlik Sense, I don't really have good idea how to trick it unless you do the trick on load script.
- Mark as New
- Bookmark
- Subscribe
- Mute
- Subscribe to RSS Feed
- Permalink
- Report Inappropriate Content
Hi,
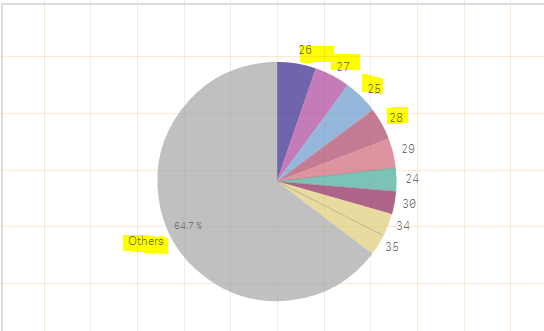
Thanks for your answer. I think I've done a mistake in my first post. It's not the label of the dimension (there is an option to hide them) but the label of the value of the dimension that I want to hide. In your example, you have the value of the green light near the Pie and you have the same label in the Legend. I just want to have the %age in the Pie and the legend.
I want to hide the text in yellow :
Regards,
Stephane.
- Mark as New
- Bookmark
- Subscribe
- Mute
- Subscribe to RSS Feed
- Permalink
- Report Inappropriate Content
Dear Stephane,
It's my misunderstanding. Now I see your point. This is not available now in Qlik Sense. I already forward your wishes to our Product team.
For now, you have to bear with that for a while, unfortunately. But thank you for bringing us the idea.
Best wishes,
Bohua
- Mark as New
- Bookmark
- Subscribe
- Mute
- Subscribe to RSS Feed
- Permalink
- Report Inappropriate Content
Bohua,
Thanks for this information. In my mind if you do not activate the legend, this visualization is good but if you activate the legend you have the same information twice.
Regards,
Stephane.
- Mark as New
- Bookmark
- Subscribe
- Mute
- Subscribe to RSS Feed
- Permalink
- Report Inappropriate Content
Hi Stéphane , I met the same problem.
Have you found a solution?
Thanks!
- Mark as New
- Bookmark
- Subscribe
- Mute
- Subscribe to RSS Feed
- Permalink
- Report Inappropriate Content
Hi,
Sorry for the delay but I tried to remember my usecase and I test it today in QS 3.0... If I activate the legend for a piechart I had the same issue.
- Dimension value is on the pie and in the legend (so same info 2 times on the screen)
- I can only show value or %age. Not value and %age.
Regards,
Stephane.