Unlock a world of possibilities! Login now and discover the exclusive benefits awaiting you.
- Qlik Community
- :
- Forums
- :
- Analytics
- :
- App Development
- :
- Re: How to get KPI of average calls per person per...
- Subscribe to RSS Feed
- Mark Topic as New
- Mark Topic as Read
- Float this Topic for Current User
- Bookmark
- Subscribe
- Mute
- Printer Friendly Page
- Mark as New
- Bookmark
- Subscribe
- Mute
- Subscribe to RSS Feed
- Permalink
- Report Inappropriate Content
How to get KPI of average calls per person per month
Hello,
I am trying to make a KPI object that shows average number of calls per person per month. I currently have the following script but can not get the per month part of the calculation. Any assistance is appreciated.
Count({$<[Liason Type]={'MSL'},[Product: Description]={'Apples'}>} DISTINCT [Call: Call ID])/count [Datetime.autoCalendar.Month]
- Tags:
- qlik sense
- Mark as New
- Bookmark
- Subscribe
- Mute
- Subscribe to RSS Feed
- Permalink
- Report Inappropriate Content
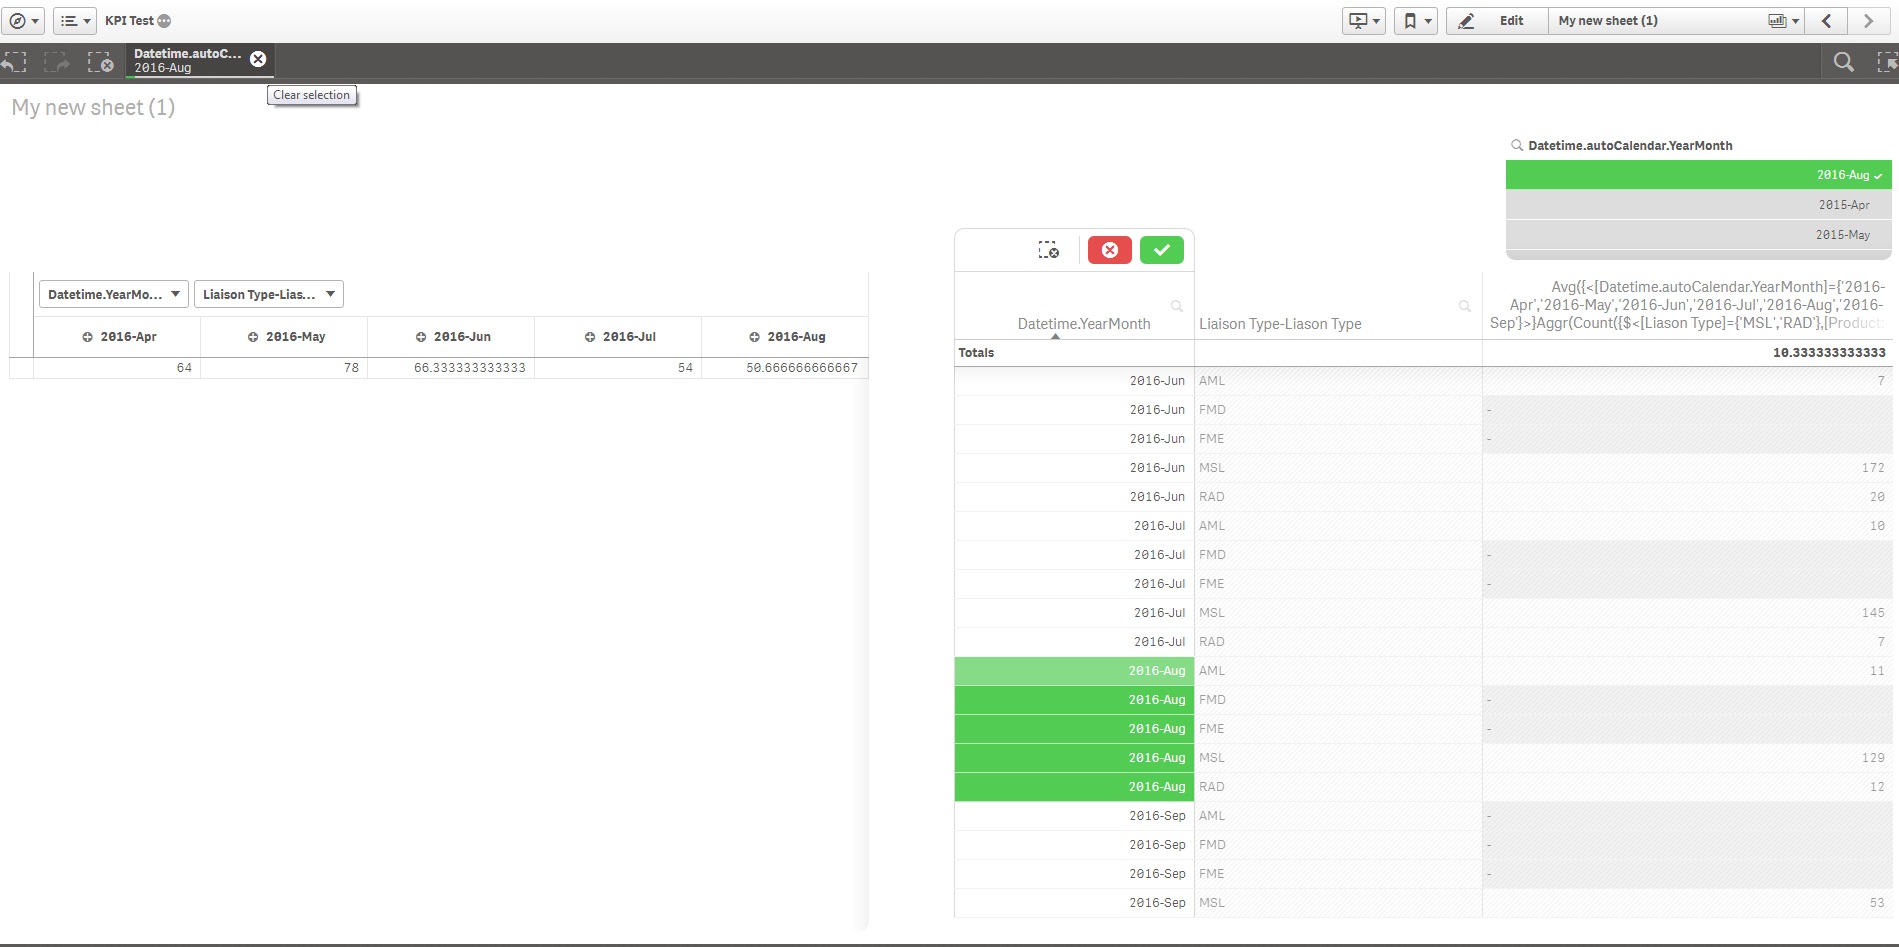
Ok, this is what I get when filtering on August 2016:
![2016-09-20 21_58_40-Edit Script [C__Users_Stefan_Downloads_Null counts.qvw_].png](/legacyfs/online/138082_2016-09-20 21_58_40-Edit Script [C__Users_Stefan_Downloads_Null counts.qvw_].png)
What do you get (remember, images may be more descriptive than just words)?
- Mark as New
- Bookmark
- Subscribe
- Mute
- Subscribe to RSS Feed
- Permalink
- Report Inappropriate Content
Ok, I get the same.
- Mark as New
- Bookmark
- Subscribe
- Mute
- Subscribe to RSS Feed
- Permalink
- Report Inappropriate Content
Ok, and when looking at these single rows for August 2016, how exactely do you want to derive your numbers from that?
- Mark as New
- Bookmark
- Subscribe
- Mute
- Subscribe to RSS Feed
- Permalink
- Report Inappropriate Content
I think the issue is the following and I understand how the script is calculating the values: The Aug value is 50.67. This is derived from taking the total number of interactions for Aug (152) and dividing by the number of Liaison types (which is 3 in Aug). This is not what I need.
I want to take the total number of interactions in Aug (152) and divide by the total number of liaisons that have a 'Liaison' type of MSL (there are 11 MSLs that should be associated with Aug and Oranges). So in this case, 152/11. This would give a value of 13.8.
Make sense?
- Mark as New
- Bookmark
- Subscribe
- Mute
- Subscribe to RSS Feed
- Permalink
- Report Inappropriate Content
What is the expression you are using to get your number 11?
- Mark as New
- Bookmark
- Subscribe
- Mute
- Subscribe to RSS Feed
- Permalink
- Report Inappropriate Content
Not using an expression. Just counting the number of liaisons in the data the have a 'Field Team' value of CNS. These liaisons are associated with the Product 'Oranges' In the QVF there is a Field Team Roster with this information.
- Mark as New
- Bookmark
- Subscribe
- Mute
- Subscribe to RSS Feed
- Permalink
- Report Inappropriate Content
If you can take your csv file and delete all the extra rows of data which we are filtering out using set analysis or selections and show how you got to 13.8, we might just be able to get this done. 
- Mark as New
- Bookmark
- Subscribe
- Mute
- Subscribe to RSS Feed
- Permalink
- Report Inappropriate Content
That's valuable information (and quite new to me).
This will reproduce your number for August:
Sum(
Aggr(Count({$<[Liason Type]={'MSL','RAD'},[Product: Description]={'Oranges'},[Datetime.autoCalendar.YearMonth]={'2016-Apr','2016-May','2016-Jun','2016-Jul','2016-Aug','2016-Sep'}>} DISTINCT [Call: Call ID])
,[Datetime.autoCalendar.YearMonth], [Liaison Type-Liason Type]))
/
Count({$<[Field Team]={'CNS'},[Product: Description]={'Oranges'},[Datetime.autoCalendar.YearMonth]={'2016-Apr','2016-May','2016-Jun','2016-Jul','2016-Aug','2016-Sep'}>}
[Field Team])
- Mark as New
- Bookmark
- Subscribe
- Mute
- Subscribe to RSS Feed
- Permalink
- Report Inappropriate Content
This did not work. It actually increased my Aug value. It also changed the Aug MSL total from 129 to 12.9. I can not seem to find the reason why?

- Mark as New
- Bookmark
- Subscribe
- Mute
- Subscribe to RSS Feed
- Permalink
- Report Inappropriate Content
The CSV does not have the Field Roster data set that is found in the QVF. This contains the number of MSLs associated with the 'Oranges' product as these MSLs are also associated with the 'CNS' field team. This is where the value of 11 is coming in to play as there are 11 MSLs associated with the 'Oranges' product. Thus 152/11 = 13.8