Unlock a world of possibilities! Login now and discover the exclusive benefits awaiting you.
- Qlik Community
- :
- All Forums
- :
- QlikView App Dev
- :
- Re: rank,aggr,dynamic dimension in a chart
- Subscribe to RSS Feed
- Mark Topic as New
- Mark Topic as Read
- Float this Topic for Current User
- Bookmark
- Subscribe
- Mute
- Printer Friendly Page
- Mark as New
- Bookmark
- Subscribe
- Mute
- Subscribe to RSS Feed
- Permalink
- Report Inappropriate Content
rank,aggr,dynamic dimension in a chart
Hi,
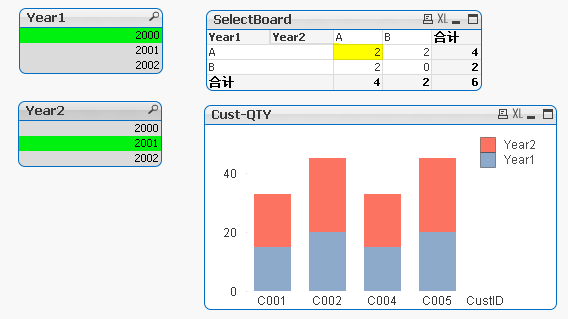
Everyone,I met a problem in below pic:
When I make a choose '2' with yellow color in the char "SelectBoard",then four CustID appear, not the correct number '2'
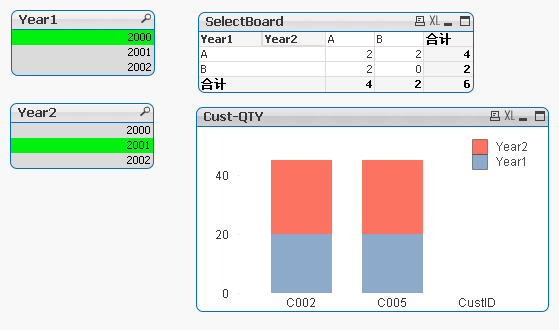
The corrent appearance is like below,
So could anyone know the reason or a solution? !
- Mark as New
- Bookmark
- Subscribe
- Mute
- Subscribe to RSS Feed
- Permalink
- Report Inappropriate Content
When you 'select' a value in an expression cell then you don't select that expression value, but you select all the dimension values used to calculate the expression value. That's one reason why you get that selection you see. There's no solution for that. You cannot select expression values.
talk is cheap, supply exceeds demand
- Mark as New
- Bookmark
- Subscribe
- Mute
- Subscribe to RSS Feed
- Permalink
- Report Inappropriate Content
If you make selections in a chart, you are basically selecting in the dimension values your grid cell is grouped by.
In your case, you are using calculated dimensions based on CustID, hence you are making selections in CustID (even if you don't see it in the chart, since you are also using set analysis to ignore CustID selections.
Create a list box for CustID and you will see the effect when selecting in your chart cell.
- Mark as New
- Bookmark
- Subscribe
- Mute
- Subscribe to RSS Feed
- Permalink
- Report Inappropriate Content
thanks for your reply, but I donnot think so. You may take a test : remove the rank function,then it works.
So,I think RANK function is the reason, that it doesn't support the Pivot table enough.
- Mark as New
- Bookmark
- Subscribe
- Mute
- Subscribe to RSS Feed
- Permalink
- Report Inappropriate Content
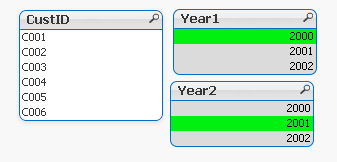
Because, You have association with All CustID, See this Image
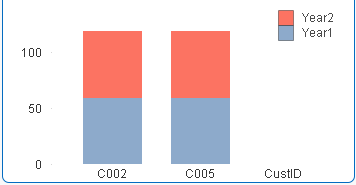
This Case, If you want to show same as your Graph, you can use this
Year1 Expression sum({<Year1, CustID={'C002','C005'}>}QTY)
Year2 Expression sum({<Year2, CustID={'C002','C005'}>}QTY)
Now, Image looks like this
- Mark as New
- Bookmark
- Subscribe
- Mute
- Subscribe to RSS Feed
- Permalink
- Report Inappropriate Content
thanks for your reply, but it's not the meaning with this case. Here is a dynamic dimensions chart, so ,your expression isn't suitable .
- Mark as New
- Bookmark
- Subscribe
- Mute
- Subscribe to RSS Feed
- Permalink
- Report Inappropriate Content
Yes, Graphs will effect based from Data Model and Associative only, Have you seen the first image, You are selected two years then associative to All CustID. Would you explain more what you want to achieve so that we will show you different menthod
- Mark as New
- Bookmark
- Subscribe
- Mute
- Subscribe to RSS Feed
- Permalink
- Report Inappropriate Content
In the SelectBoard, Here means Levels change between two periods