Unlock a world of possibilities! Login now and discover the exclusive benefits awaiting you.
- Qlik Community
- :
- All Forums
- :
- QlikView App Dev
- :
- Re: Presentation of a chart like in the appendix?
- Subscribe to RSS Feed
- Mark Topic as New
- Mark Topic as Read
- Float this Topic for Current User
- Bookmark
- Subscribe
- Mute
- Printer Friendly Page
- Mark as New
- Bookmark
- Subscribe
- Mute
- Subscribe to RSS Feed
- Permalink
- Report Inappropriate Content
Presentation of a chart like in the appendix?
Hi all,
I want to know, if and how it is possible to present a chart like in the appendix.
There are different groups of data. Is this possible?
Ex:
| Group | A | B |
|---|---|---|
| Test1 | ||
| ABC | .93 | |
| DEF | 23.4 | |
| Test2 | ||
| XYC | 54 | |
| dhj | 64 | |
| etc | etc | etc |
As you can see in the appendix - the example is very huge.
Thank you for helping.
- « Previous Replies
-
- 1
- 2
- Next Replies »
- Mark as New
- Bookmark
- Subscribe
- Mute
- Subscribe to RSS Feed
- Permalink
- Report Inappropriate Content
Hi Robert,
How are your colours imported? Are manually or automatic?
How do you have calculated two bars? One by test?
Regards!!
- Mark as New
- Bookmark
- Subscribe
- Mute
- Subscribe to RSS Feed
- Permalink
- Report Inappropriate Content
Hi all,
here a new trial with explanations in the graph. Hope that's easier for you:
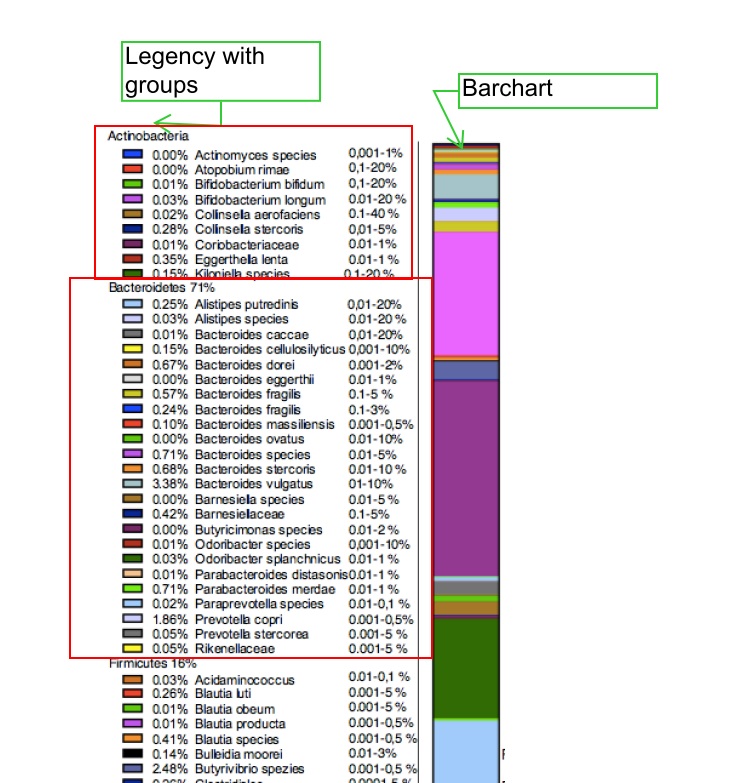
The collours are set automatically.
Regards
- Mark as New
- Bookmark
- Subscribe
- Mute
- Subscribe to RSS Feed
- Permalink
- Report Inappropriate Content
Hi,
I guess what you need is a combination of a stacked bar chart with legend and a pivot or straight table, showing the data.
Use the group of bacteria and the bacteria name as dimension and the first percentage as expression.
- Mark as New
- Bookmark
- Subscribe
- Mute
- Subscribe to RSS Feed
- Permalink
- Report Inappropriate Content
Hi Robert,
You need a stacked barchart and a pivot table. On pivot table you will calculate values for % for each group and item. The problem is that you need to calculate the colours to see the same colour on pivot table and barchart.
Regards!!
- Mark as New
- Bookmark
- Subscribe
- Mute
- Subscribe to RSS Feed
- Permalink
- Report Inappropriate Content
Thank you!
Can u give me an example with the data above?
Thank you very much
- Mark as New
- Bookmark
- Subscribe
- Mute
- Subscribe to RSS Feed
- Permalink
- Report Inappropriate Content
See attached, I have calculated the colours on script.
Regards!
- « Previous Replies
-
- 1
- 2
- Next Replies »