Unlock a world of possibilities! Login now and discover the exclusive benefits awaiting you.
- Qlik Community
- :
- All Forums
- :
- QlikView App Dev
- :
- Question on Rank()
- Subscribe to RSS Feed
- Mark Topic as New
- Mark Topic as Read
- Float this Topic for Current User
- Bookmark
- Subscribe
- Mute
- Printer Friendly Page
- Mark as New
- Bookmark
- Subscribe
- Mute
- Subscribe to RSS Feed
- Permalink
- Report Inappropriate Content
Question on Rank()
Hello All -
I'm trying to create a fairly simple bar chart that ranks sales by customer. The expression is a simple sum of sales and I want the rank on the Axis.
For the Axis, I'm using
rank(Aggr(sum({<CompanyGroup = >}BilledAmount),CompanyGroup))
The expression for the bar is
sum({<CompanyGroup *= >}BilledAmount)
Which works until a company is selected I have the color set up to grey-out the unselected:
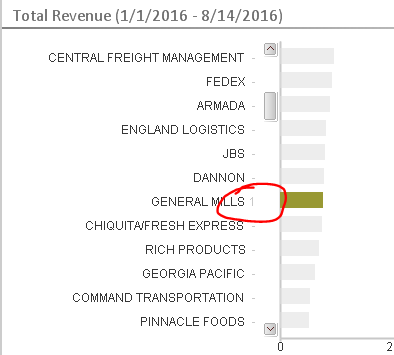
But the rank goes to 1 when a company is selected and I actually want it to keep its actual rank. I thought the {<CompanyGroup = >} would accomplish it, but no luck.
Any thoughts?
Thanks!
mike
Accepted Solutions
- Mark as New
- Bookmark
- Subscribe
- Mute
- Subscribe to RSS Feed
- Permalink
- Report Inappropriate Content
How about this:
Aggr(Rank(Sum({<CompanyGroup = >} BilledAmount)) * Avg(1), CompanyGroup))
- Mark as New
- Bookmark
- Subscribe
- Mute
- Subscribe to RSS Feed
- Permalink
- Report Inappropriate Content
How about this:
Aggr(Rank(Sum({<CompanyGroup = >} BilledAmount)) * Avg(1), CompanyGroup))
- Mark as New
- Bookmark
- Subscribe
- Mute
- Subscribe to RSS Feed
- Permalink
- Report Inappropriate Content
You are da man! Worked like a charm.
- Mark as New
- Bookmark
- Subscribe
- Mute
- Subscribe to RSS Feed
- Permalink
- Report Inappropriate Content
Hello Sunny,
Would you mind explaining this *Avg(1) what is this used for ??
Thanks,
V.
- Mark as New
- Bookmark
- Subscribe
- Mute
- Subscribe to RSS Feed
- Permalink
- Report Inappropriate Content
Was not 100% sure if it was needed or not, but just to be safe I added it 