Unlock a world of possibilities! Login now and discover the exclusive benefits awaiting you.
- Qlik Community
- :
- All Forums
- :
- QlikView App Dev
- :
- colormix, color gradient
- Subscribe to RSS Feed
- Mark Topic as New
- Mark Topic as Read
- Float this Topic for Current User
- Bookmark
- Subscribe
- Mute
- Printer Friendly Page
- Mark as New
- Bookmark
- Subscribe
- Mute
- Subscribe to RSS Feed
- Permalink
- Report Inappropriate Content
colormix, color gradient
Hello all,
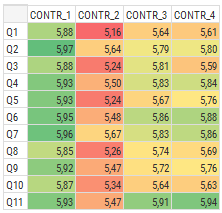
I have pivot table with two dimmenssios (Quesion and Controller).
The result is the average score the controller get for every question, scores: 1-6 (generaly the scores are close to the 6).
My expression: avg(SCORE)
| CONTR_1 | CONTR_2 | CONTR_3 | CONTR_4 | |
| Q1 | 5,88 | 5,16 | 5,64 | 5,61 |
| Q2 | 5,97 | 5,64 | 5,79 | 5,80 |
| Q3 | 5,88 | 5,24 | 5,81 | 5,59 |
| Q4 | 5,93 | 5,50 | 5,83 | 5,84 |
| Q5 | 5,93 | 5,24 | 5,67 | 5,76 |
| Q6 | 5,95 | 5,48 | 5,86 | 5,88 |
| Q7 | 5,96 | 5,67 | 5,83 | 5,86 |
| Q8 | 5,85 | 5,26 | 5,74 | 5,69 |
| Q9 | 5,92 | 5,47 | 5,72 | 5,76 |
| Q10 | 5,87 | 5,34 | 5,64 | 5,63 |
| Q11 | 5,93 | 5,47 | 5,91 | 5,94 |
I would like like to collor the background of cells depends on the value. I expect results simmilar as below:
Accepted Solutions
- Mark as New
- Bookmark
- Subscribe
- Mute
- Subscribe to RSS Feed
- Permalink
- Report Inappropriate Content
- Mark as New
- Bookmark
- Subscribe
- Mute
- Subscribe to RSS Feed
- Permalink
- Report Inappropriate Content
- Mark as New
- Bookmark
- Subscribe
- Mute
- Subscribe to RSS Feed
- Permalink
- Report Inappropriate Content
Hi,
You can do this by using visual cues or by adding a background color to your expression.
For example, use If(avg(SCORE) >= 5,70,RGB(0,255,0),If(avg(SCORE) >= 5,50,RGB(255,0,0))) would turn all fields with an average score >= 5,70 into green and those with an average score < 5,70 and >= 5,050 into red.