Unlock a world of possibilities! Login now and discover the exclusive benefits awaiting you.
- Qlik Community
- :
- All Forums
- :
- QlikView App Dev
- :
- X axis dimension filter
- Subscribe to RSS Feed
- Mark Topic as New
- Mark Topic as Read
- Float this Topic for Current User
- Bookmark
- Subscribe
- Mute
- Printer Friendly Page
- Mark as New
- Bookmark
- Subscribe
- Mute
- Subscribe to RSS Feed
- Permalink
- Report Inappropriate Content
X axis dimension filter
Hi all,
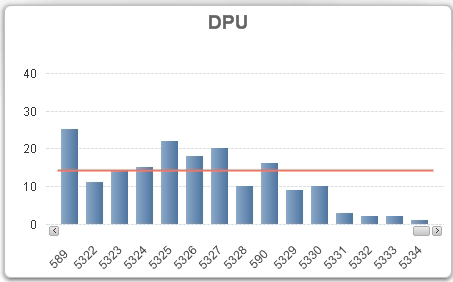
The above chart's x dimension has serial numbers and the chart is sorted by the start line date which goes into november 2016. I only want to see the 15 serials that are most recent based on the start line date. They are showing above, but I want to get rid of the scroll bar because the y axis sometimes gets messed up since some of the previous serial numbers have higher values than the 15 displayed. If i could get rid of that scroll bar, the highest y axis would be about 30. I can't use the static max / min because the numbers change so often drastically.
- Mark as New
- Bookmark
- Subscribe
- Mute
- Subscribe to RSS Feed
- Permalink
- Report Inappropriate Content
May be use set analysis or calculated dimension to show a certain range?
- Mark as New
- Bookmark
- Subscribe
- Mute
- Subscribe to RSS Feed
- Permalink
- Report Inappropriate Content
I believe you can turn off the scrolling in Presentation Chart Scrolling options.
Or use the Dimension Limits (second tab from the beginning)
- Mark as New
- Bookmark
- Subscribe
- Mute
- Subscribe to RSS Feed
- Permalink
- Report Inappropriate Content
I agree, but how? I've tried using set analysis but I can't figure out how to do it since the dates are later than today's date, and also always changing.
- Mark as New
- Bookmark
- Subscribe
- Mute
- Subscribe to RSS Feed
- Permalink
- Report Inappropriate Content
You can, but I need to see the last 15 only. If I turn off the scrolling I see everything, which I do not want.
- Mark as New
- Bookmark
- Subscribe
- Mute
- Subscribe to RSS Feed
- Permalink
- Report Inappropriate Content
Not sure how the data is, but may be
{<Date = {"$(='>=' & Max(Date) - 15 & '<=' & Max(Date))"}>}
- Mark as New
- Bookmark
- Subscribe
- Mute
- Subscribe to RSS Feed
- Permalink
- Report Inappropriate Content
I tried this:
sum({<START_LINE_DT = {"$(='>=' & Max(START_LINE_DT) - 50 & '<=' & Max(START_LINE_DT))"}>} REJECT_QTY)
and it says no data to display
- Mark as New
- Bookmark
- Subscribe
- Mute
- Subscribe to RSS Feed
- Permalink
- Report Inappropriate Content
How is START_LINE_DT formatted? Like a date or a number? If it is date, may be try this
Sum({<START_LINE_DT = {"$(='>=' & Date(Max(START_LINE_DT) - 50, 'DateFieldFormatHere') & '<=' & Date(Max(START_LINE_DT), 'DateFieldFormatHere'))"}>} REJECT_QTY)