Unlock a world of possibilities! Login now and discover the exclusive benefits awaiting you.
- Qlik Community
- :
- All Forums
- :
- QlikView App Dev
- :
- Re: Stack Bar Chart - 100% Stack Bar Chart
- Subscribe to RSS Feed
- Mark Topic as New
- Mark Topic as Read
- Float this Topic for Current User
- Bookmark
- Subscribe
- Mute
- Printer Friendly Page
- Mark as New
- Bookmark
- Subscribe
- Mute
- Subscribe to RSS Feed
- Permalink
- Report Inappropriate Content
Stack Bar Chart - 100% Stack Bar Chart
Hi Experts,
Facing a scenario where in i am getting the values in the form of stack bar chart but i want to show that in the form of 100% stack bar chart.
Dimensions - Week and Category
Category has the formula -
IF (Aggr(Sum(AMOUNT_CLIENT), [CLIENTNUMBER],[YEAR],[WEEK]) < 10, 'Low Spender',
IF (Aggr(Sum(AMOUNT_CLIENT), [CLIENTNUMBER],[YEAR],[WEEK]) >= 10 AND Aggr(Sum(AMOUNT_CLIENT), [CLIENTNUMBER],[YEAR],[WEEK]) <25, 'Average Spender',
IF (Aggr(Sum(AMOUNT_CLIENT), [CLIENTNUMBER],[YEAR],[WEEK]) >= 25 AND Aggr(Sum(AMOUNT_CLIENT), [CLIENTNUMBER],[YEAR],[WEEK]) <50, 'Hign Spender',' Very Hign Spender')))
Measure is Count(DISTINCT [CLIENTNUMBER])
These are basically categorized in Bucketing system.
If you need any more details let me know.
Thanks
Message was edited by: Ishan Kumar
- « Previous Replies
-
- 1
- 2
- Next Replies »
Accepted Solutions
- Mark as New
- Bookmark
- Subscribe
- Mute
- Subscribe to RSS Feed
- Permalink
- Report Inappropriate Content
I don't see a reason why it won't.
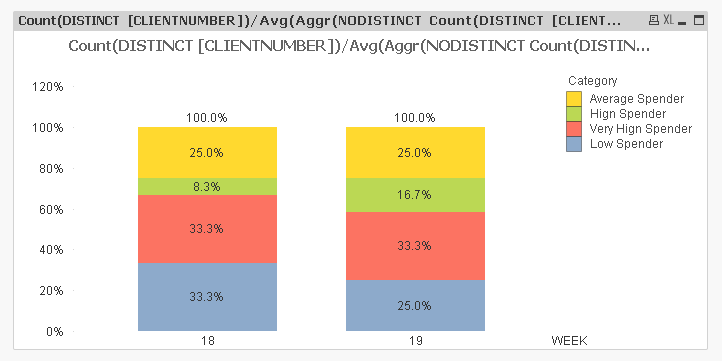
Dimension
WEEK
IF (Aggr(Sum(AMOUNT_CLIENT), [CLIENTNUMBER],[YEAR],[WEEK]) < 10, 'Low Spender',
IF (Aggr(Sum(AMOUNT_CLIENT), [CLIENTNUMBER],[YEAR],[WEEK]) >= 10 AND Aggr(Sum(AMOUNT_CLIENT), [CLIENTNUMBER],[YEAR],[WEEK]) <25, 'Average Spender',
IF (Aggr(Sum(AMOUNT_CLIENT), [CLIENTNUMBER],[YEAR],[WEEK]) >= 25 AND Aggr(Sum(AMOUNT_CLIENT), [CLIENTNUMBER],[YEAR],[WEEK]) <50, 'Hign Spender',' Very Hign Spender')))
Expression
Count(DISTINCT [CLIENTNUMBER])/Avg(Aggr(NODISTINCT Count(DISTINCT [CLIENTNUMBER]), WEEK))
- Mark as New
- Bookmark
- Subscribe
- Mute
- Subscribe to RSS Feed
- Permalink
- Report Inappropriate Content
May be try this:
Count(DISTINCT [CLIENTNUMBER])/Count(TOTAL <Week> DISTINCT [CLIENTNUMBER])
- Mark as New
- Bookmark
- Subscribe
- Mute
- Subscribe to RSS Feed
- Permalink
- Report Inappropriate Content
Hi Sunny,
I go the values as 400%
may be because i have bucketing involved in this?
- Mark as New
- Bookmark
- Subscribe
- Mute
- Subscribe to RSS Feed
- Permalink
- Report Inappropriate Content
Hi Sunny,
It is showing me as 400%.
have checked but the values are not right.
we have bucketing as part of my dimension and i feel that might be creating a problem.
- Mark as New
- Bookmark
- Subscribe
- Mute
- Subscribe to RSS Feed
- Permalink
- Report Inappropriate Content
Not Working..
Its showing me in the form of 400%
I think i am using bucketing here so it is taking 100% each for bucketing.
Please suggest further.
- Mark as New
- Bookmark
- Subscribe
- Mute
- Subscribe to RSS Feed
- Permalink
- Report Inappropriate Content
Can you share a sample?
- Mark as New
- Bookmark
- Subscribe
- Mute
- Subscribe to RSS Feed
- Permalink
- Report Inappropriate Content
Taking help of Sunny Equation here
this will group it more detailed
Count(DISTINCT [CLIENTNUMBER])/Count(TOTAL <Year,Week> DISTINCT [CLIENTNUMBER])
- Mark as New
- Bookmark
- Subscribe
- Mute
- Subscribe to RSS Feed
- Permalink
- Report Inappropriate Content
Hi Sunny,
I have attached the sample in the start Bucketing.csv
Please let me know the solution for it.
- Mark as New
- Bookmark
- Subscribe
- Mute
- Subscribe to RSS Feed
- Permalink
- Report Inappropriate Content
See if this is what you wanted Ishan
Count(DISTINCT [CLIENTNUMBER])/Avg(Aggr(NODISTINCT Count(DISTINCT [CLIENTNUMBER]), WEEK))
- Mark as New
- Bookmark
- Subscribe
- Mute
- Subscribe to RSS Feed
- Permalink
- Report Inappropriate Content
Hi Sunny,
Yes this is what i wanted.
How did you achieve this?
What should be in the dimension and measure?
- « Previous Replies
-
- 1
- 2
- Next Replies »