Unlock a world of possibilities! Login now and discover the exclusive benefits awaiting you.
- Qlik Community
- :
- All Forums
- :
- QlikView App Dev
- :
- Re: Calculate stock of event on going over the mon...
- Subscribe to RSS Feed
- Mark Topic as New
- Mark Topic as Read
- Float this Topic for Current User
- Bookmark
- Subscribe
- Mute
- Printer Friendly Page
- Mark as New
- Bookmark
- Subscribe
- Mute
- Subscribe to RSS Feed
- Permalink
- Report Inappropriate Content
Calculate stock of event on going over the months
Hello Everyone,
In order to manage a stock of on-going tasks, I would like to compare their creation and resolution date. And to follow up the trend in a line graph.
Here are my data :
Key | StatusTask | Month |
A1 | Created | Sep-15 |
A2 | Created | Oct-15 |
A3 | Created | Nov-15 |
A4 | Created | Dec-15 |
A5 | Created | Jan-16 |
A6 | Created | Feb-16 |
A7 | Created | Mar-16 |
A8 | Created | Apr-16 |
A9 | Created | May-16 |
A10 | Created | Jun-16 |
A1 | Resolved | Jan-16 |
A2 | Resolved | Feb-16 |
A7 | Resolved | Apr-16 |
A8 | Resolved | May-16 |
A5 | Resolved | Jun-16 |
A3 | Resolved | Jul-16 |
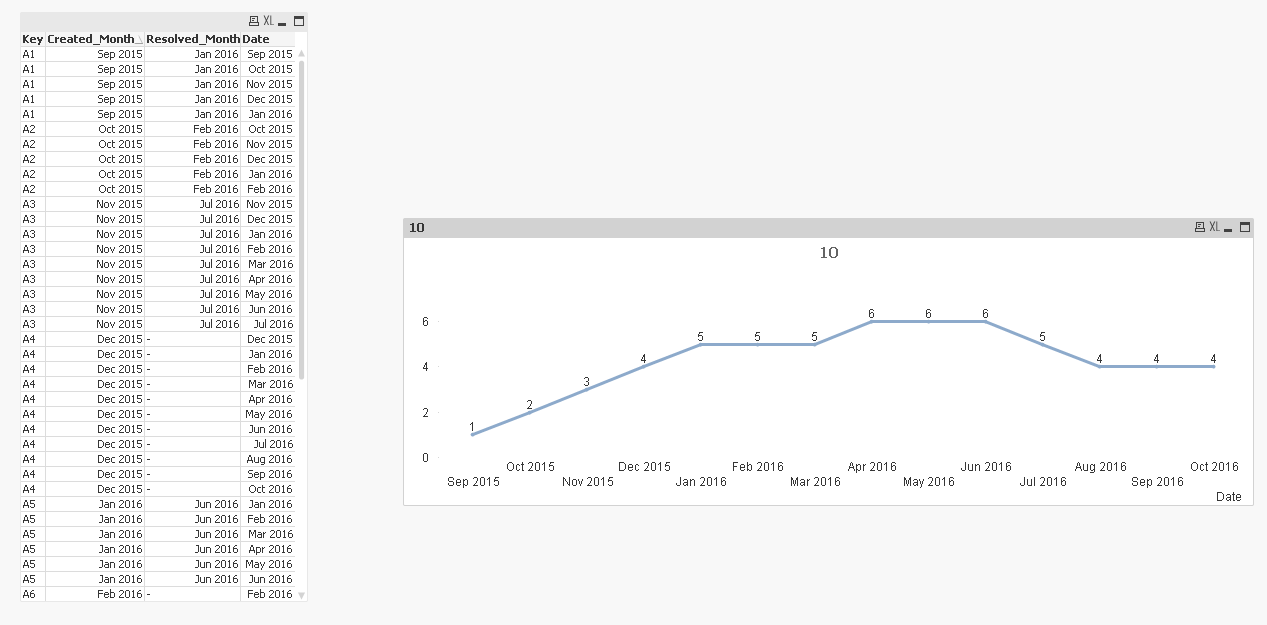
Results I would like to get and then to show in a line chart
Month | Still opened |
Sep-15 | 1 |
Oct-15 | 2 |
Nov-15 | 3 |
Dec-15 | 4 |
Jan-16 | 4 |
Feb-16 | 4 |
Mar-16 | 5 |
Apr-16 | 5 |
May-16 | 5 |
Jun-16 | 5 |
Jul-16 | 4 |
For a given month, the following code is working perfectly, but I am not able to make it work in a line graph with Date as abscissa for whatever reasons:
count( {< StatusTask = {Created}, Month = {'<=$(=max(Month))'} >}Key) - count( {< StatusTask = {Resolved}, Month = {'<=$(=max(Month))'} >}Key)
As well, in the graph I have tried unsuccessfully:
aggr(count( {< StatusTask = {Created}, Month = {'<=$(=max(Month))'} >}Key) - count( {< StatusTask = {Resolved}, Month = {'<=$(=max(Month))'} >}Key), Month)
Once in the line Graph, the result is always given me the difference between Created and Resolved on only one month instead of all the past months ( Month = {'<=$(=max(Month))'} )
Do you have any idea, how could I solve this issue?
Thanks in advance for your help,
Steven
Accepted Solutions
- Mark as New
- Bookmark
- Subscribe
- Mute
- Subscribe to RSS Feed
- Permalink
- Report Inappropriate Content
I think it is easy to do with manipulation in the script.
Script:
Table:
LOAD Key,
MonthName(Date#(Month, 'MMM-YY')) as Created_Month
FROM
[https://community.qlik.com/thread/235756]
(html, codepage is 1252, embedded labels, table is @1)
Where StatusTask = 'Created';
Left Join (Table)
LOAD Key,
MonthName(Date#(Month, 'MMM-YY')) as Resolved_Month
FROM
[https://community.qlik.com/thread/235756]
(html, codepage is 1252, embedded labels, table is @1)
Where StatusTask = 'Resolved';
FinalTable:
LOAD Key,
Created_Month,
Resolved_Month,
MonthName(AddMonths(Created_Month, IterNo() - 1)) as Date
Resident Table
While AddMonths(Created_Month, IterNo() - 1) <= If(Len(Trim(Resolved_Month)) = 0, MonthName(Today()), Resolved_Month);
DROP Table Table;
- Mark as New
- Bookmark
- Subscribe
- Mute
- Subscribe to RSS Feed
- Permalink
- Report Inappropriate Content
Perfect it is exactly what I was looking for, I didn't think to work directly on the Script  , Thank you very much.
I have just modified a line since I want the resolution month to be out of the "stock" (I didn't mention it in my original post)
if(MonthName(AddMonths(Created_Month, IterNo() - 1)) = Resolved_Month, Date#('Jan-1999', 'mmm-yyyy'),MonthName(AddMonths(Created_Month, IterNo() - 1))) as Date
Then exclude Jan-1999 of my analysis