Unlock a world of possibilities! Login now and discover the exclusive benefits awaiting you.
- Qlik Community
- :
- All Forums
- :
- QlikView App Dev
- :
- Re: Displaying last 12 months in a Chart
- Subscribe to RSS Feed
- Mark Topic as New
- Mark Topic as Read
- Float this Topic for Current User
- Bookmark
- Subscribe
- Mute
- Printer Friendly Page
- Mark as New
- Bookmark
- Subscribe
- Mute
- Subscribe to RSS Feed
- Permalink
- Report Inappropriate Content
Displaying last 12 months in a Chart
Hello,
I am looking for some help on restricting a chart to display the recent 12 month's data. Chart looks like the attachment and the set expressions are pasted below.
Dimension:
=Month(MakeDate(2015,FISC_MTH_NBR)) // FISC_MTH_NBR is the Fiscal equivalent of a month
Expressions:
Num(Sum({<FISC_YR_NBR={"$(=Only({1}YearofToday))"},DateNum={">=$(=Num(FISC_YR_START_DT))<=$(=Num(Today()))"}>} PRICE),'#,###,###,##0') // YearofToday is a variable defined at the Script level which is if(Date=Today(),FISC_YR_NBR) as YearofToday
I have 4 of such expressions which will display the Revenue and Margin for Current and Prior Years.
The solutions/suggestions already discussed in the community will not help me as i am not using the date column in my expressions.
Thanks.
- « Previous Replies
-
- 1
- 2
- Next Replies »
- Mark as New
- Bookmark
- Subscribe
- Mute
- Subscribe to RSS Feed
- Permalink
- Report Inappropriate Content
Would you be able to share a sample with expected output to try it out?
- Mark as New
- Bookmark
- Subscribe
- Mute
- Subscribe to RSS Feed
- Permalink
- Report Inappropriate Content
Attached a sample qvw file here. The 2nd Sheet has 2 different charts, and i would like to restrict both of them to show the last 12 months in a rolling fashion.
- Mark as New
- Bookmark
- Subscribe
- Mute
- Subscribe to RSS Feed
- Permalink
- Report Inappropriate Content
Does this look right?
Expressions
This Year
Sum({<DateNum = {"$(='>' & Num(AddMonths(Max({<Sales = {'*'}>}DateNum), -12)) & '<=' & Max({<Sales = {'*'}>}DateNum))"}, Date, Fisc_day_of_month, Fisc_Period, FISCALMONTHNBR, FISCALYEAR, YearofToday, MonthofToday, FISCALYEARSTART, FISCALMONTHSTART, FISCALQUARTERSTART>}Sales)
Last Year
Sum({<DateNum = {"$(='>' & Num(AddMonths(Max({<Sales = {'*'}>}DateNum), -24)) & '<=' & Num(AddMonths(Max({<Sales = {'*'}>}DateNum), -12)))"}, Date, Fisc_day_of_month, Fisc_Period, FISCALMONTHNBR, FISCALYEAR, YearofToday, MonthofToday, FISCALYEARSTART, FISCALMONTHSTART, FISCALQUARTERSTART>} Sales)
- Mark as New
- Bookmark
- Subscribe
- Mute
- Subscribe to RSS Feed
- Permalink
- Report Inappropriate Content
Thanks for your efforts Sunny.
The second should start in Nov and the right most bar should be the current month which is October.
Also, the expressions uses the DateNum which is the regular calendar date, so i'll validate the values of bars to check if they are confined to the Fiscal Month rather than the Regular calendar months.
- Mark as New
- Bookmark
- Subscribe
- Mute
- Subscribe to RSS Feed
- Permalink
- Report Inappropriate Content
This for the bottom chart?
What is your fiscal year start date?
- Mark as New
- Bookmark
- Subscribe
- Mute
- Subscribe to RSS Feed
- Permalink
- Report Inappropriate Content
My Fiscal year start date varies every year, and it is captured in a column in my calendar dimension table.
Fiscal Year Start Date will be the name of the column.
Ganesh Bagavathi
- Mark as New
- Bookmark
- Subscribe
- Mute
- Subscribe to RSS Feed
- Permalink
- Report Inappropriate Content
I think it might be helpful if you can tell me the numbers you expect to see for each of the bars.
- Mark as New
- Bookmark
- Subscribe
- Mute
- Subscribe to RSS Feed
- Permalink
- Report Inappropriate Content
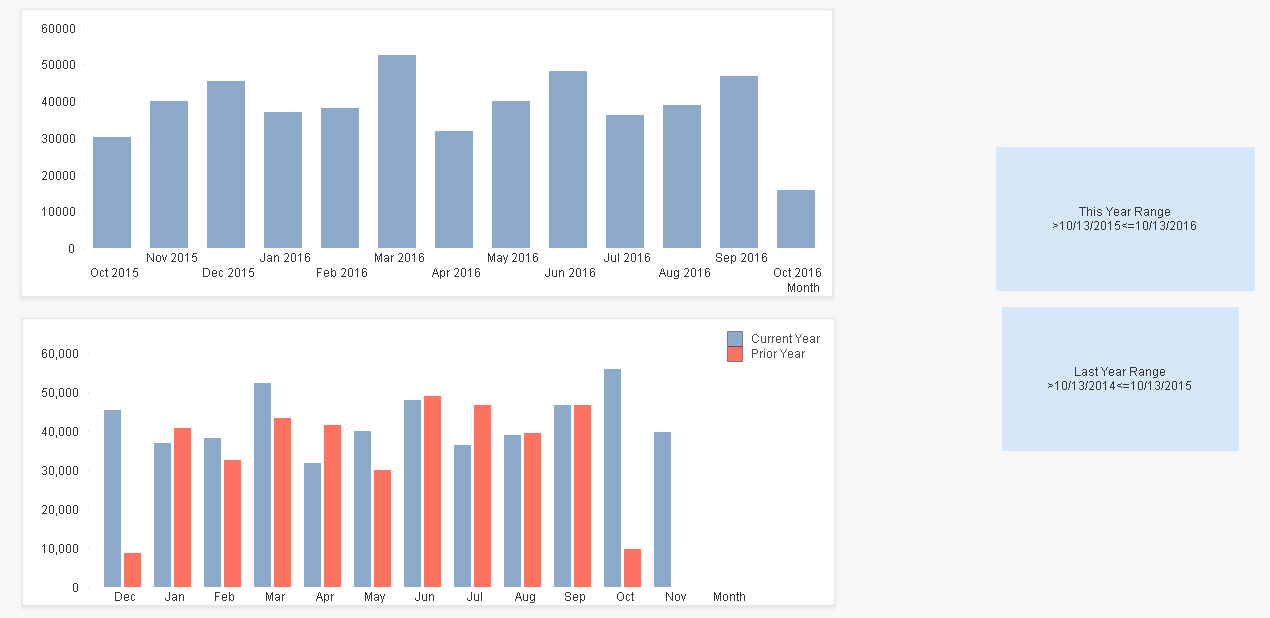
I am looking for 2 bar charts, the first one with MonthYear should have the 12 months starting from the current month at the right most point and goes back for 11 months.
The second bar chart with just the Month names should have 2 sets of bars one for current year and another for prior year. And this should also be in a rolling fashion with Oct (Current month) at the right most point and goes backfor 11 months.
The application which i shared is just a sample, so when i implement this in my actual application, it might not be a feasible solution to include every column in the expression as my table will have close to 20 columns. Is there any other way to achieve this?
The numbers at the top chart are matching and is good. But the bottom one with 2 sets of bars are not displaying correctly, For example, for current year we dont have data for Nov, but there is a blue bar for Nov. And the right most bar should be Oct, but we see Nov here.
Thanks for your time and efforts.
- Mark as New
- Bookmark
- Subscribe
- Mute
- Subscribe to RSS Feed
- Permalink
- Report Inappropriate Content
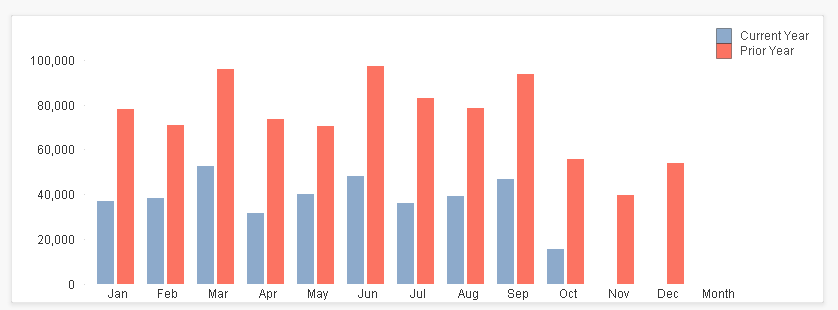
I am still not sure what is needed from the 2nd chart
Current Year
1) 10/13/2015 to 10/13/2016
2) 01/01/2016 to 10/13/2016
Previous Year
1) 10/13/2014 to 10/13/2015
2) 01/01/2015 to 12/31/2015
Do you want your 2nd chart to show which of the two ranges for Current Year and Previous Year? Also what is the required sort order for your second chart?
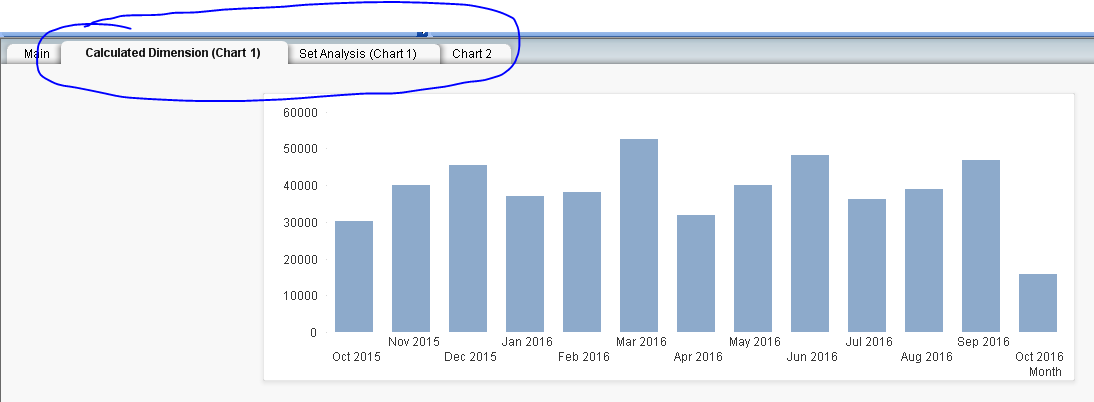
Another option for the first chart where no manipulation is required in the expression is this
Dimension
=If(DateNum >= Num(AddMonths(Max(TOTAL {<Sales = {'*'}>}DateNum), -12)), Date(Date#(Fisc_Period,'YYYYMM'),'MMM YYYY'))
(NOTE: Check 'Suppress When Value Is Null' on the dimensions tab)
Expression
Sum(Sales)
- « Previous Replies
-
- 1
- 2
- Next Replies »